Palantir: Delivers Another Strong Performance, Can the AI Application Leader Regain Its Peak?
 02/03 2026
 548
548
Palantir announced its Q4 2025 earnings after the market closed on February 2 (ET). Overall, the results were impressive, with few areas for criticism.
Notably, Q4 growth accelerated again, including forward-looking indicators, directly alleviating market concerns about the sustainability of high growth that underpins its high valuation.
However, the post-market stock price reaction (up less than 8%) suggests a relatively more rational market compared to previous periods. Based on sentiment from H1 2024 to H1 2025, a rise of at least 10% would have been expected. What factors are influencing this?
Let's examine the financial report first:
1. The U.S. market continues to lead growth: Q4 U.S. regional revenue surged 93%, strongly countering peak concerns.
(1) U.S. government sector: Secures major contracts, defying seasonal slowdowns
U.S. government revenue is considered Palantir's moat. This quarter, revenue growth was driven by the recognition of prior contracts, raising the growth rate to 60%. On December 10, Palantir secured a $448 million naval order—launching ShipOS in collaboration with the U.S. Navy, applying Foundry and AIP technologies in overseas operations.
The initial quarter of the new fiscal year is typically a slow period for government procurement, as approvals take time, often delaying purchasing needs.
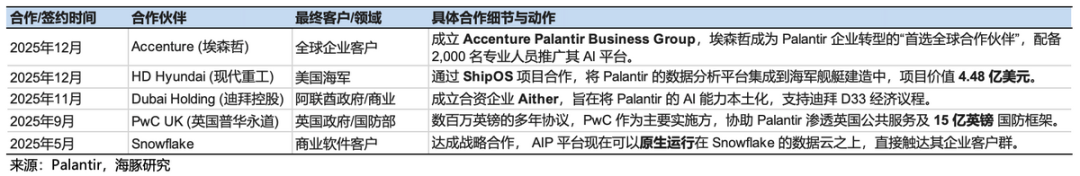
The strong performance despite seasonal slowdowns aligns with Dolphin Research's view last quarter that procurement system reforms benefit Palantir. Additionally, we believe sustained U.S. government budgets for Palantir may relate to its collaborative ecosystem alliance. By partnering with industrial machinery, construction, and military firms already involved in government projects, Palantir co-provides comprehensive solutions to the government.
(2) U.S. enterprises: Leverages consulting partnerships to reuse client resources
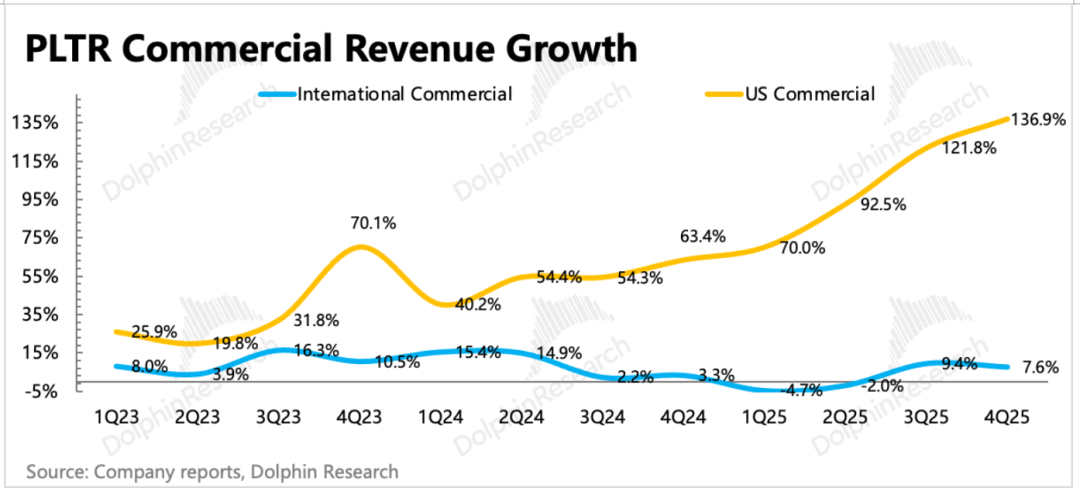
U.S. enterprise revenue is the core driver of Palantir's future growth and a primary valuation support. Q4 U.S. commercial revenue accelerated to 137%, continuing its rapid growth despite a high base.
Driven by collaborative wins, Palantir partnered with leading consulting firms like KPMG and Accenture, integrating its modules into their overall solutions while accessing their client networks and channels.
2. International markets have significant flaws, relying on governments rather than enterprises
Q4 international revenue depended heavily on demand from international governments (e.g., UK, UAE), while enterprise client demand remained low but stable. As previously noted, Palantir's local protectionism, deep ties with the U.S. Department of Defense, and operational environment issues have affected European enterprises' willingness to sign contracts.
3. Forward-looking indicators are largely flawless:
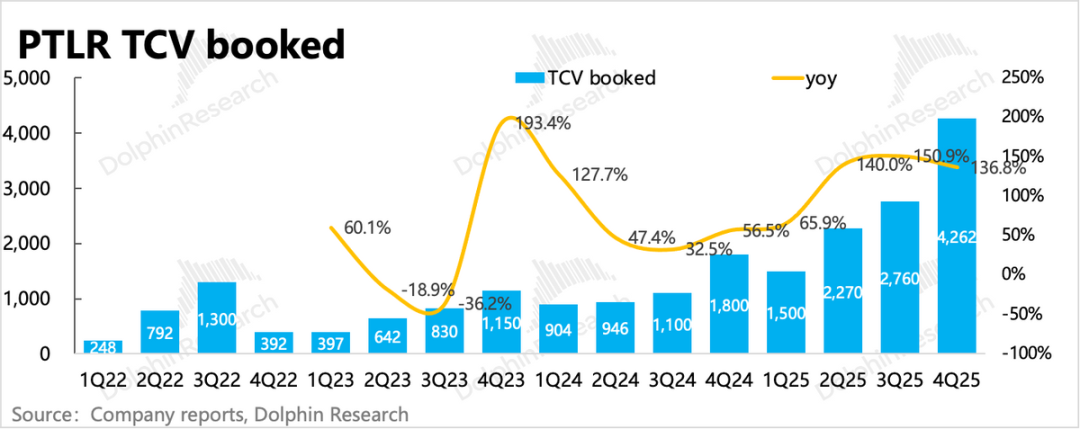
(1) Medium- to long-term focus on TCV, RPO, and client count: Q4 TCV (Total Contract Value) surged 137% YoY to $4.26 billion, with U.S. commercial orders growing 67.4% QoQ, slowing slightly, indicating short-term new contracts are primarily government-driven.
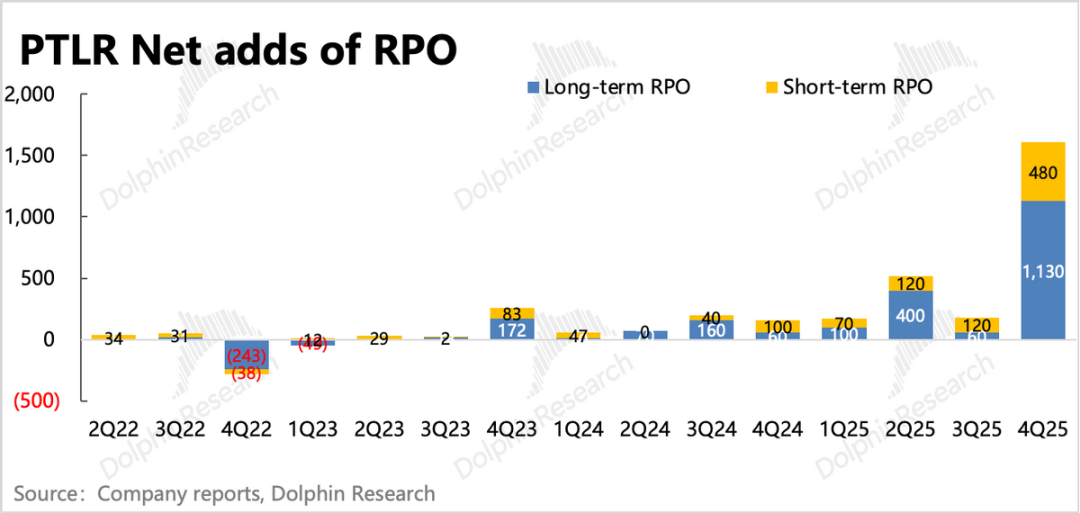
RPO (Remaining Performance Obligations) shows the value of locked contracts (non-cancelable), with Q4 growth soaring to 144%. This suggests clients are accelerating long-term service commitments with higher total values.
Comparing TCV, newly added government contracts are often directly locked, either from new U.S. orders or strong government partnerships (e.g., UK). Based on disclosed contract information, we speculate the increment (increment) mainly comes from the UK government.
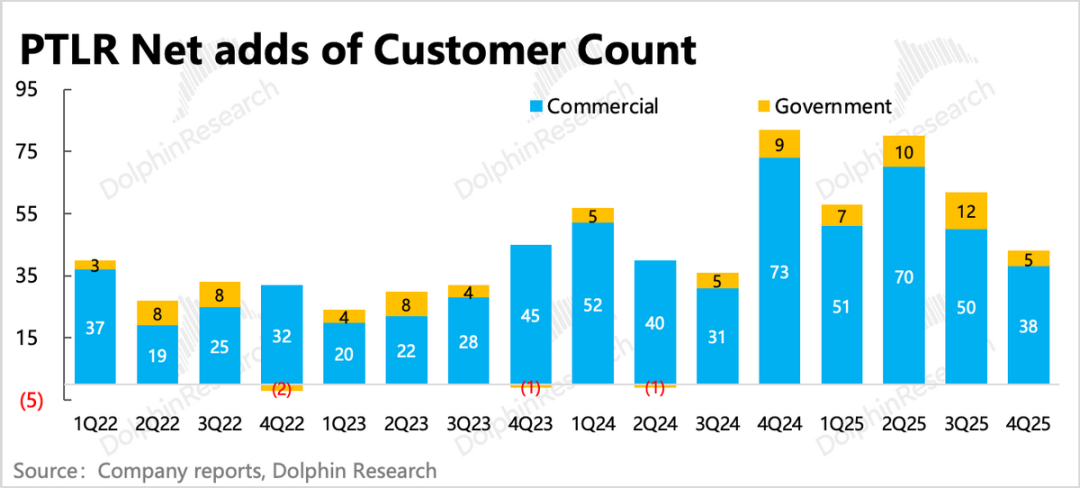
Client count rose by a net 43, with 5 new government partners (departments) and 38 new enterprises, mostly U.S.-based. While net client additions declined QoQ, contract values and revenue recognition accelerated, indicating rising average client spending.
In software SaaS, where pricing remains unchanged, rising client spending suggests superior product services and increased loyalty among existing clients, leading them to add new services to existing solutions.
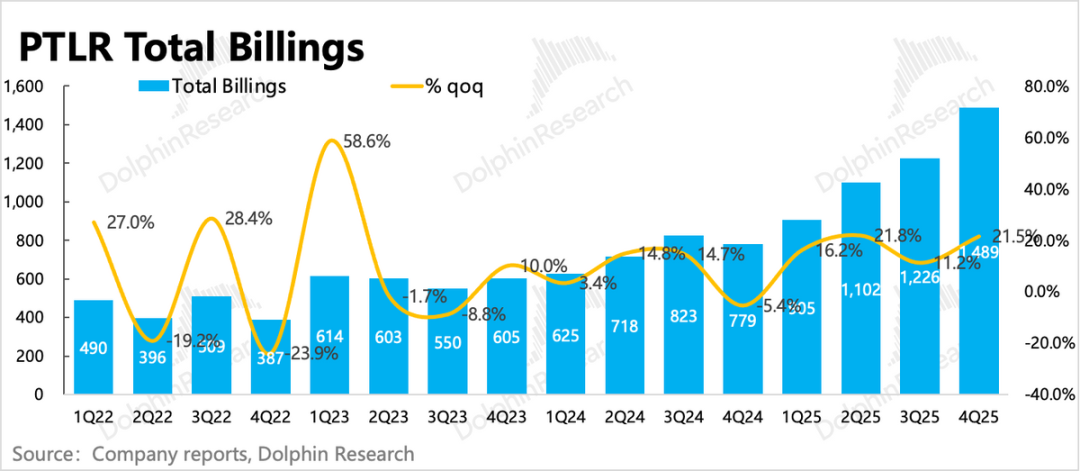
(2) Short-term market focus on Billings and NDR changes: Q4 Billings grew 91% YoY, with overall contract liabilities (including client deposits) rising nearly $80 million QoQ. Net expansion rate from existing clients reached 139%, continuing to improve, aligning with discussions on enhanced client loyalty.
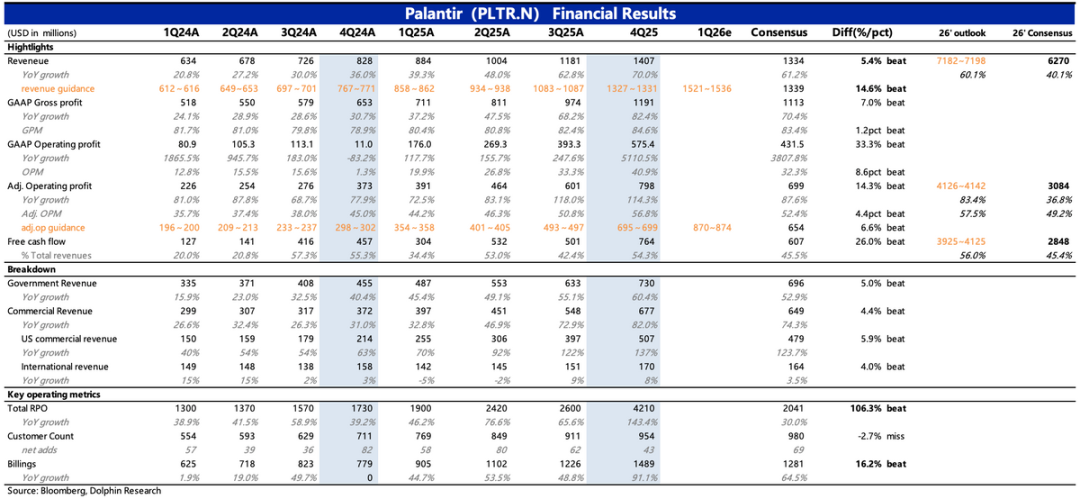
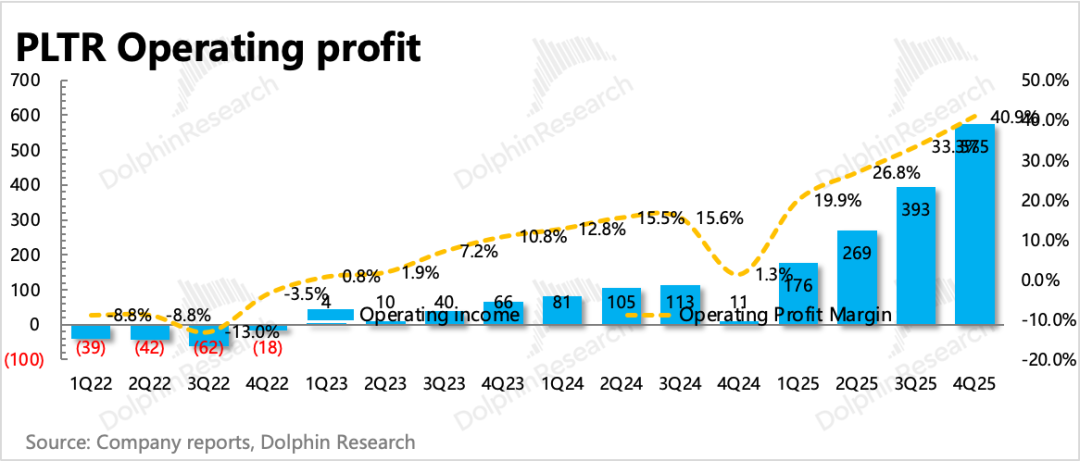
4. Guidance exceeds expectations: Finally, Q1 revenue is expected to grow 73%, accelerating from Q4, with an operating margin of 57%, roughly flat QoQ. Additionally, the company guided for 60% growth in 2026 with a 57.5% margin. If management maintains its typically conservative guidance style, actual future performance could be even more explosive.
5. Performance metrics overview
Dolphin Research's View
Q4 results reflect a period of accelerated monetization for Palantir, driven by new client acquisitions and existing client expansions. Both current performance and forward-looking indicators are strong.
Compared to last quarter's financial report day, Palantir's market cap shrank from a peak of nearly $500 billion to $380 billion post-market. However, results from the past two quarters confirm Palantir's solid fundamentals.
Regardless of valuation rationality (reasonableness), focusing solely on marginal changes, under the market sentiment from 2024 to H1 2025, this report would justify a rise of over 10%, not just the current 8%.
The discrepancy may stem from lingering market concerns about AI-native applications disrupting traditional software—a narrative where Palantir, while AI-enabled, might be viewed as a traditional application at risk of peak disruption.
Dolphin Research believes Palantir's highly customized, deep, and vertical products, coupled with complex client relationships, make it highly unlikely to be disrupted by AI-native applications.
Instead, concerns about slowing TCV growth and net client additions, coupled with high buy-side expectations (accustomed to 10-20% beats), uncertainty about government procurement sustainability, and reduced incremental buying post-S&P 500 inclusion, are more likely to weigh on Palantir's short-term trajectory. Unless a future report delivers an even more explosive result to offset these worries.
While post-report feedback was tepid, Palantir's valuation remains elevated based on updated guidance. Assuming 2026 operating profit of $4.1 billion and a typical 10-20% beat (yielding $4.5-4.9 billion EBIT), the post-market cap of $375 billion implies 76-79x EV/EBIT. Conservatively using guidance, it implies 91x EV/EBIT—both well above peers. To sustain this valuation, Palantir must maintain rapid growth for another 2-3 years, requiring strong conviction.
Detailed Analysis Below
I. Local Market Continues to Drive Growth
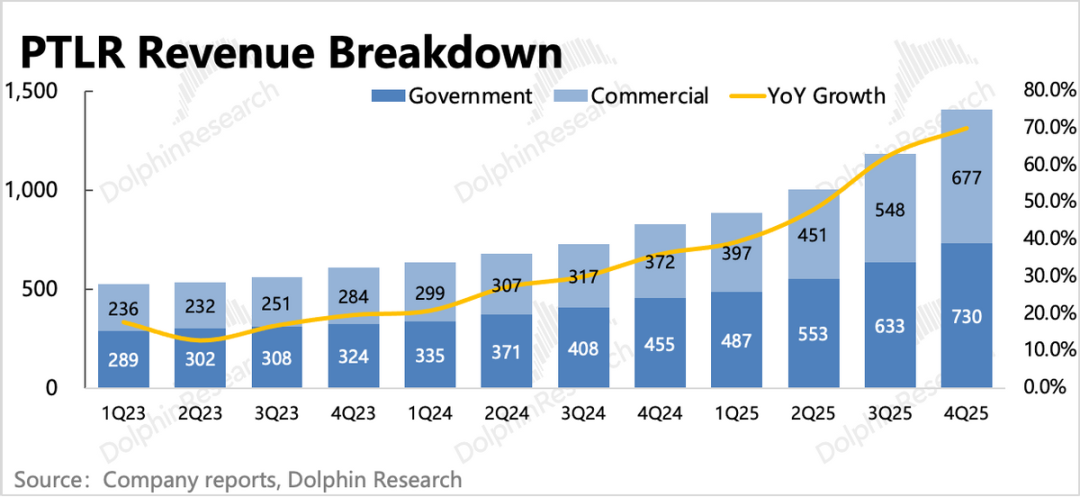
Q4 total revenue reached $1.41 billion, up 70% YoY, exceeding market expectations (~$1.33 billion), with growth accelerating sequentially.
Palantir primarily provides customized software services, making short-term revenue highly predictable, with narrow guidance ranges reflecting high income certainty. However, after two years of tracking, Dolphin Research finds Palantir's management often conservative in guidance, likely raising buy-side expectations.
1. Segment Performance
(1) Government Client Revenue: U.S. Accelerates
Q4 government client revenue grew 60% YoY, led by local governments with accelerated growth. International government growth slowed but remained in the high range.
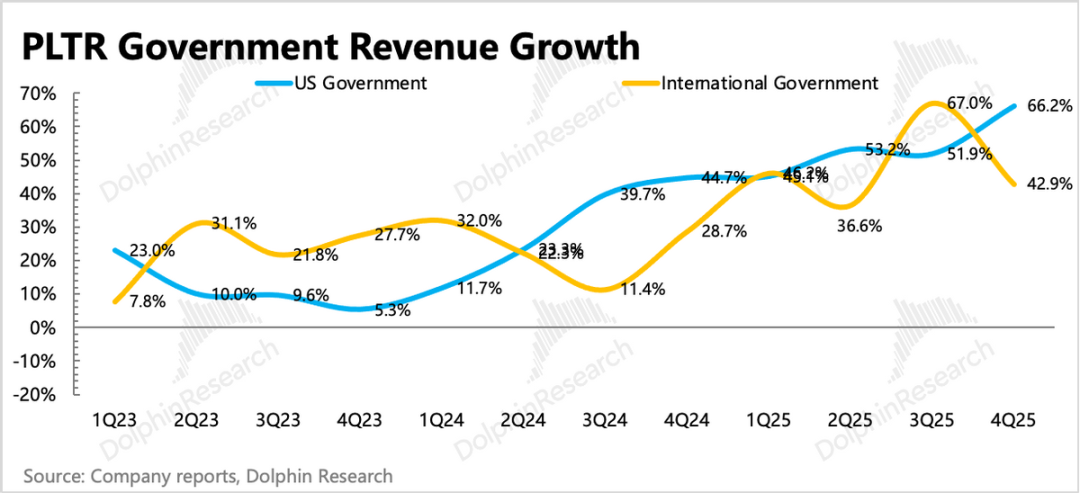
International government revenue rose 43%, likely driven by service period confirmations of UK and Polish Ministry of Defense orders from H1. Additionally, in September, Palantir, via PWC UK, participated in a £1.5 billion defense framework and public services project.
(2) Commercial Market: U.S. Demand Explodes, International Stable
Q4 commercial revenue grew 82% YoY, accelerating from a strong Q3. Breakdown:
U.S. enterprise revenue surged 137%, driven by both new client penetration and increased loyalty among existing clients, with net dollar retention reaching 139% (implying 34% growth in payments from users over the past 12 months).
International enterprise growth remained stable in the high single digits, but client count fell by 3 QoQ. As noted last quarter, beyond demand factors (European enterprises have limited budgets for innovative technologies under economic pressure), European firms also question Palantir's deep ties with the U.S. Department of Defense. Thus, future growth in international commercial markets remains highly uncertain.
II. Forward-Looking Indicators: Back on Acceleration
For software firms, future growth potential is core to valuation. However, quarterly revenue is a lagging indicator. We recommend focusing on new contract acquisitions, primarily contract metrics (RPO, TCV), current billings (Billings), and client count growth.
Overall, both long- and short-term indicators show some slowing. While normal last year, at current valuation levels, market scrutiny is understandable.
(1) Remaining Performance Obligations (RPO): Long-term contracts surge
Q4 RPO jumped to $4.2 billion, up nearly $1.6 billion QoQ, including the $450 million naval ShipOS contract, a $310 million UK Ministry of Defense add-on order, and 61 enterprise client orders exceeding $10 million each.
(2) Billings & Deferred Revenue: Healthy but slowing
Q4 billings reached nearly $1.5 billion, up 91% YoY, driven by major contract signings and payments. Overall contract liabilities (including client deposits) rose QoQ, with existing clients' payment scale expansion rate reaching 139%, continuing to improve, reflecting stronger client loyalty and upgrade trends.
(3) Total Contract Value (TCV): Seasonal fluctuations, but healthy growth
Q4 TCV reached $4.26 billion, up 137% YoY and $1.5 billion QoQ, largely in sync with RPO. This indicates most new contracts are locked-in demands, reflecting high confidence in Palantir's products.
(4) Client Additions: Growth driven by U.S. enterprises
Q4 saw a net addition of 43 clients, with 38 from commercial clients (mostly U.S. enterprises) and 5 from governments.
III. Profitability Continues to Improve, Driven by Product Premiums and Channel Synergies
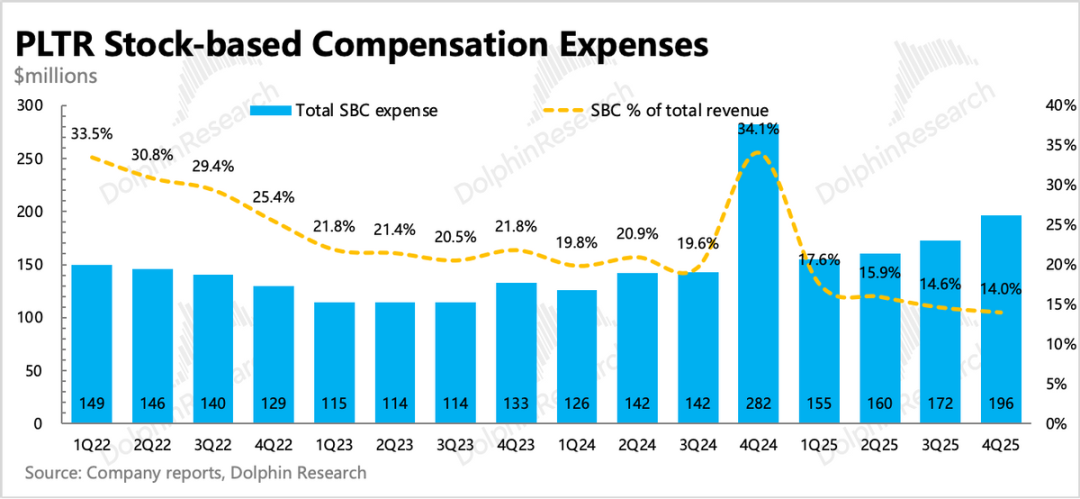
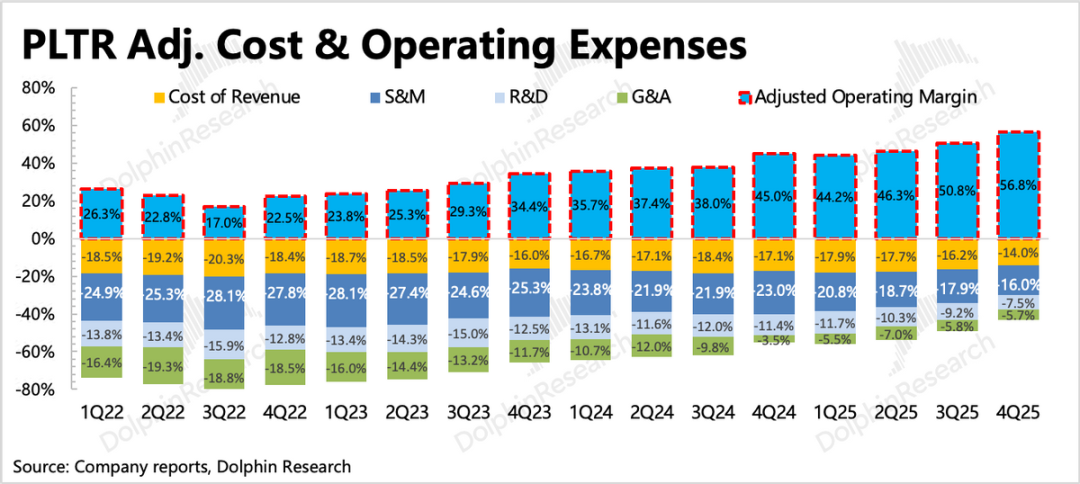
Q4 Palantir achieved $575 million in GAAP operating profit, with notable declines in sales and administrative expense growth. This drove GAAP operating margin up 7 points QoQ to 41%, with adjusted operating margin (excluding depreciation and SBC) reaching 57%.
Palantir's model is relatively labor-intensive, but efficiency gains may stem from collaborative projects with partners, leveraging their mature sales channels to reduce necessary sales expenditures.
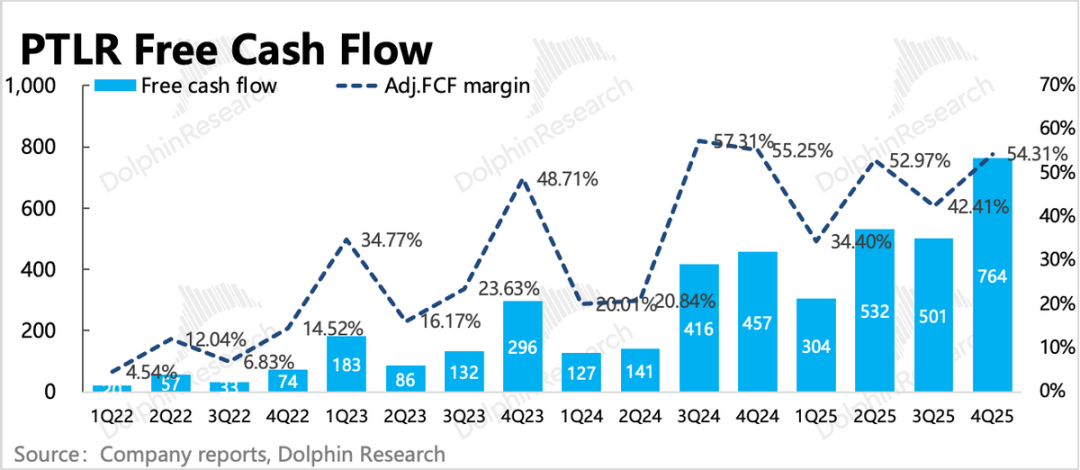
Palantir's cash flow is related to contract payments, so there will be fluctuations between seasons. In the fourth quarter, many new contract orders were added, and under normal payment conditions, the operating cash flow reached a new high. The management's full-year guidance for cash flow is 3.9-4.1 billion (with cash already accumulated on the books), and the current market capitalization of 350 billion corresponds to a cash flow valuation of approximately EV/FCF=87.5x, which is still not low.
- END -
// Reposting with Permission
This article is an original piece from Dolphin Research. Authorization is required for any republication.
// Disclaimer and General Disclosure Notice
This report is intended solely for general comprehensive data purposes, aimed at users of Dolphin Research and its affiliated entities for general browsing and data reference. It does not take into account the specific investment objectives, investment product preferences, risk tolerance, financial situation, or special needs of any individual receiving this report. Investors must consult with an independent professional advisor before making any investment decisions based on this report. Any person making investment decisions based on the content or information referenced in this report does so at their own risk. Dolphin Research shall not be liable for any direct or indirect responsibility or loss that may arise from the use of the data contained in this report. The information and data contained in this report are based on publicly available sources and are for reference purposes only. Dolphin Research strives to ensure, but does not guarantee, the reliability, accuracy, and completeness of the relevant information and data.
The information or views expressed in this report shall not, under any jurisdiction, be construed as or regarded as an offer to sell securities or an invitation to buy or sell securities, nor shall it constitute advice, a quotation, or a recommendation regarding relevant securities or related financial instruments. The information, tools, and data contained in this report are not intended for, nor are they intended to be distributed to, jurisdictions where the distribution, publication, provision, or use of such information, tools, and data would contravene applicable laws or regulations or would require Dolphin Research and/or its subsidiaries or affiliated companies to comply with any registration or licensing requirements in such jurisdictions, or to citizens or residents of such jurisdictions.
This report solely reflects the personal views, insights, and analytical methods of the relevant creators and does not represent the stance of Dolphin Research and/or its affiliated entities.
This report is produced by Dolphin Research, and the copyright is solely owned by Dolphin Research. Without the prior written consent of Dolphin Research, no institution or individual shall (i) produce, copy, replicate, reproduce, forward, or create any form of copies or reproductions in any manner, and/or (ii) directly or indirectly redistribute or transfer to other unauthorized persons. Dolphin Research reserves all related rights.
-
![]()
Total Investment Hits Nearly 3.28 Billion! Goertek Launches Mass Production of 12-Inch Transparent Substrate Wafer for AR Glasses’ Micro-Nano Optical Components
-
![]()
Why Is This Precision Optical Film Leader Worth Reevaluating with a Tens of Millions Procurement?
-
![]()
AI Costs Plummet by 90% Over Nine Years: Key Insights from Davos You Shouldn’t Miss
-
Doubao, Your Late-Night AI Companion, Now Eyes Profitability
-
![]()
SRC Empowers SEER Intelligence to Reach a Market Cap of Tens of Billions, Yet Fails to Sustain Profitability
-
![]()
China’s Embodied AI Industry Faces Fierce Domestic Competition, Making Overseas Expansion Essential for Survival
-
![]()
32.8 Billion Yuan Investment! Goertek’s 12-Inch AR Glasses Optical Wafer Base in Lingang Begins Operations
-
![]()
How Far is the All-New Li Auto L8 from Being the Best Five-Seat SUV with In-House Full-Stack Development?