What Does the Post-Breakup Healing Period Entail? When Will Microsoft Reclaim Its Former Glory?
 05/08 2026
 423
423
After the U.S. stock market closed on April 30, Microsoft unveiled its financial report for the third quarter of FY26, which concluded in March. Overall, Microsoft's performance this quarter was predominantly marked by 'stability,' with most key metrics outperforming market expectations, yet lacking notable standout features. Here's a detailed analysis:
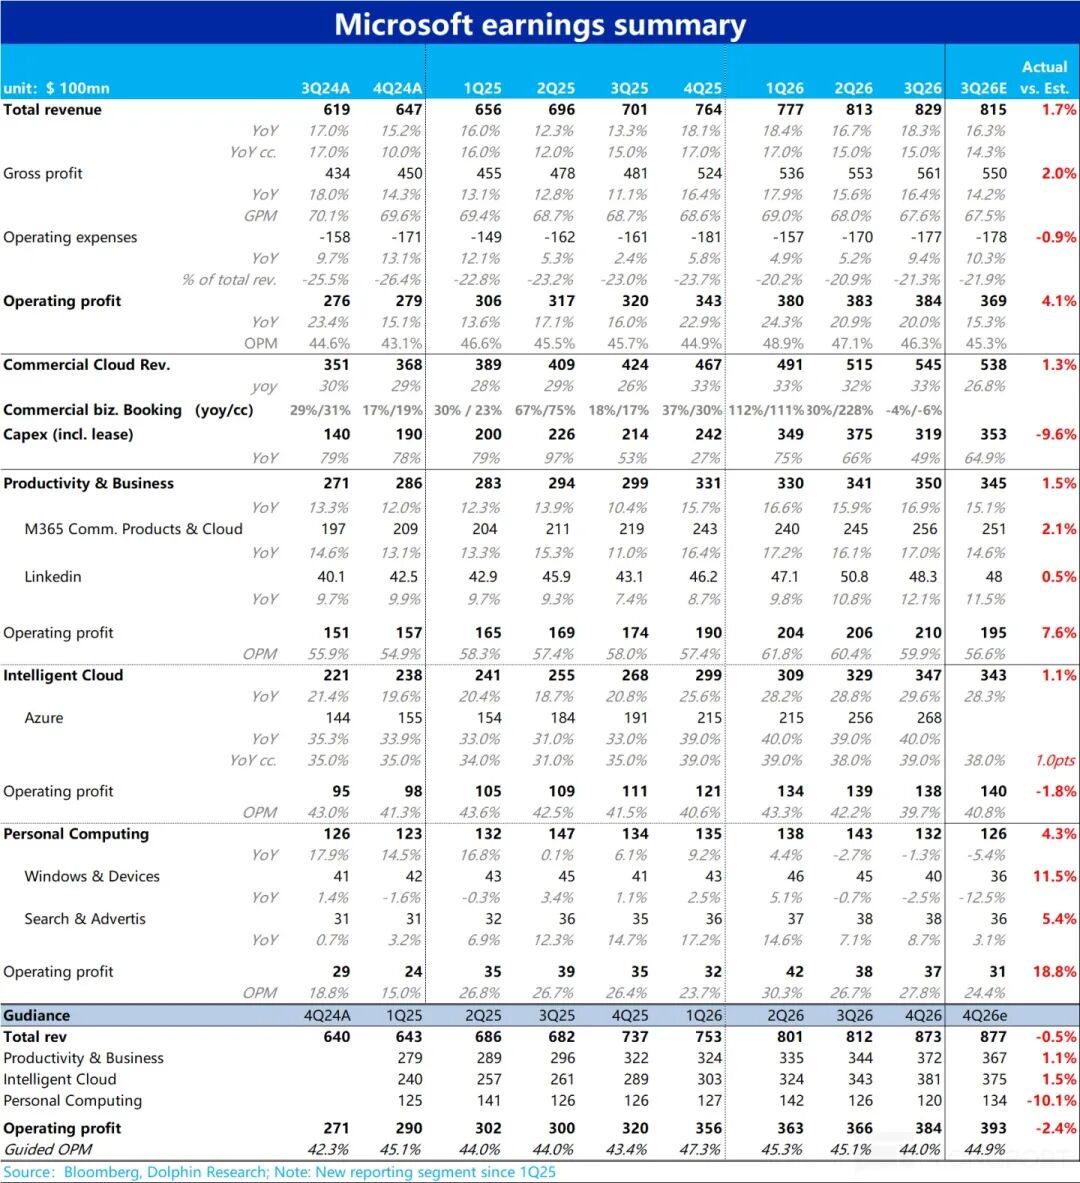
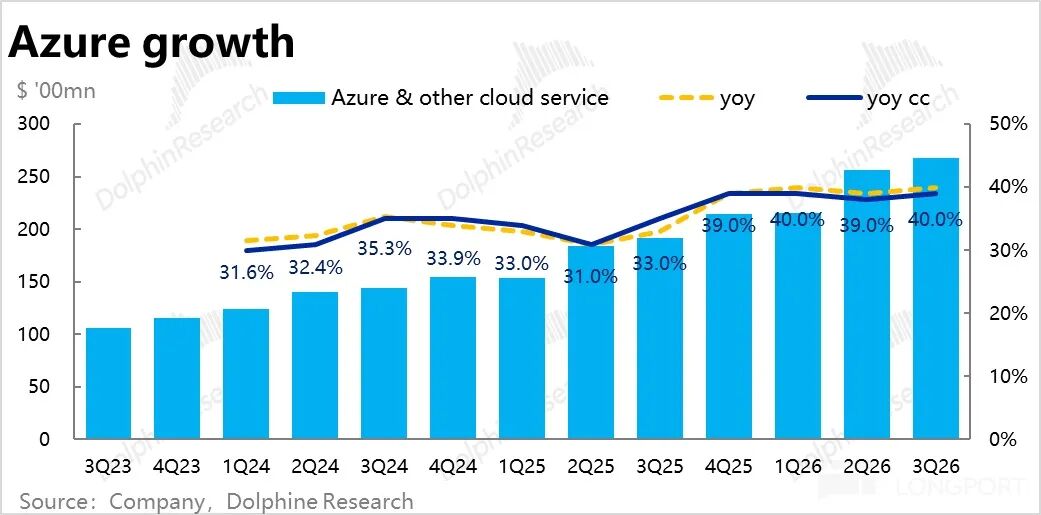
1. Azure regains momentum but offers no surprises: This quarter, the highly anticipated Azure business witnessed a 40% year-over-year (YoY) revenue increase, or 39% excluding currency impacts, accelerating by 1 percentage point (pct) from the previous quarter. While this reacceleration is undoubtedly a positive sign, when juxtaposed with the robust acceleration of AWS and GCP this quarter, Azure's performance still falls relatively short.
Dolphin Research posits that the primary reasons behind this are the further decoupling of Microsoft's collaboration with OpenAI and the impact of OpenAI (OAI) shifting compute orders to other Cloud Service Providers (CSPs). Another contributing factor is Microsoft's stated priority of allocating compute resources to 1P products (such as Copilot) and development usage (proprietary models).
2. Capex decreases unexpectedly, aligning with Azure growth: Corresponding to Azure's growth plateau, the downgrade of its cooperation with OpenAI, and the reduction in new orders, Microsoft's actual capital expenditure (Capex), inclusive of leasing, amounted to $31.9 billion this quarter. This represents a month-on-month (or quarter-on-quarter) decline of over $5 billion, falling below market expectations.
This also indicates that Microsoft's investment intensity dynamically aligns with front-end demand. Consequently, as Microsoft anticipates Azure's growth to reaccelerate in the second half of the year, it has projected that next quarter's Capex will surge to $40 billion, with FY26 annual Capex reaching up to $190 billion. This implies an average quarterly expenditure exceeding $50 billion for the remaining three quarters—a substantial increase.
3. Office business sustains growth through price hikes: The core Office business (encompassing enterprise and consumer versions) within the Productivity segment experienced largely stable seat growth this quarter, with revenue growth maintained through price increases.
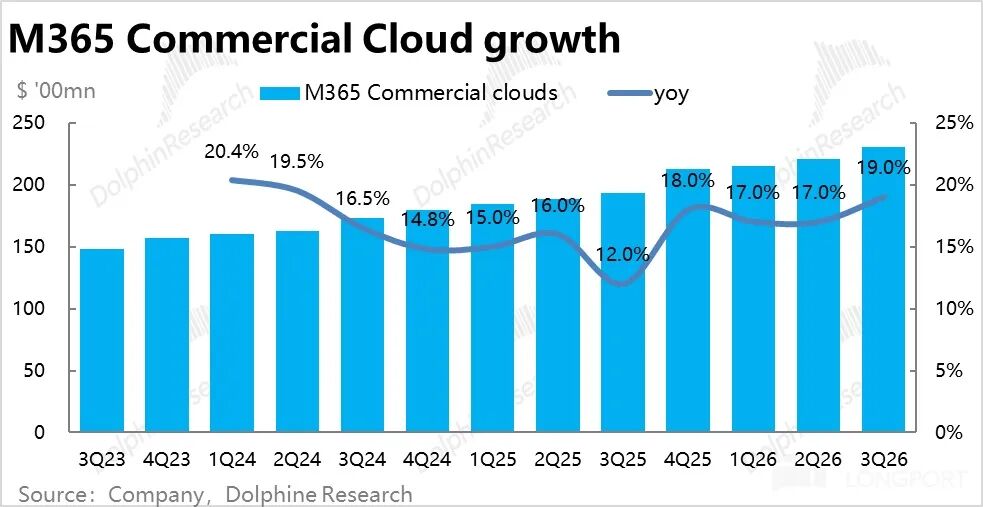
Specifically, revenue from commercial Microsoft 365 cloud services, the second most crucial segment, grew by 19%, accelerating by 2 pcts from the previous quarter. However, excluding currency tailwinds, the more genuine sequential revenue acceleration was 1 pct.
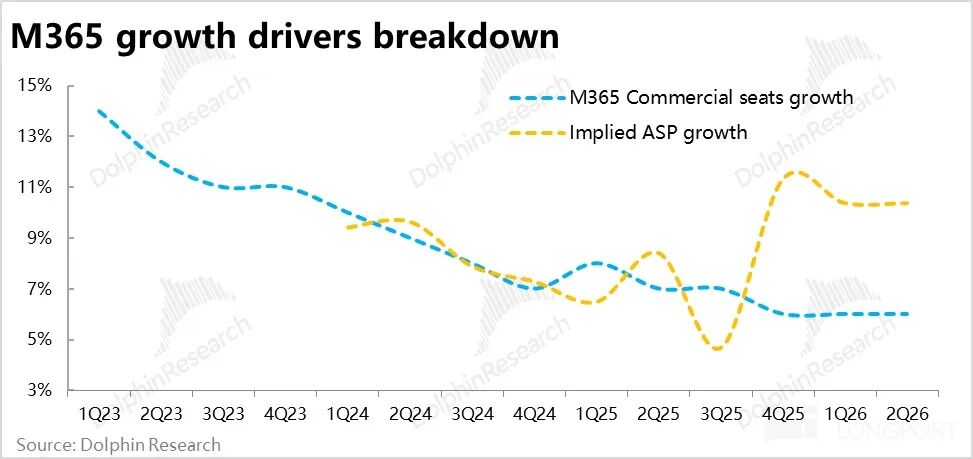
In terms of volume and price, the number of commercial M365 subscription seats increased by 6% YoY, remaining flat from the previous quarter, while the implied YoY increase in average revenue per user was approximately 12%, likely attributable to product mix upgrades and currency tailwinds.
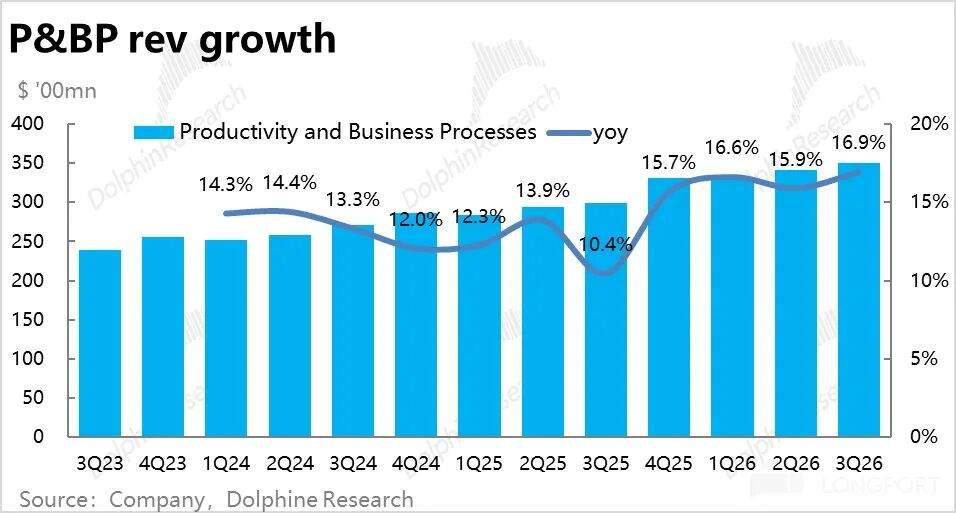
Nevertheless, other business lines generally exhibited weak growth, resulting in an overall growth rate of 13% for the Productivity segment, excluding currency impacts—a slight deceleration of 1 pct from the previous quarter.
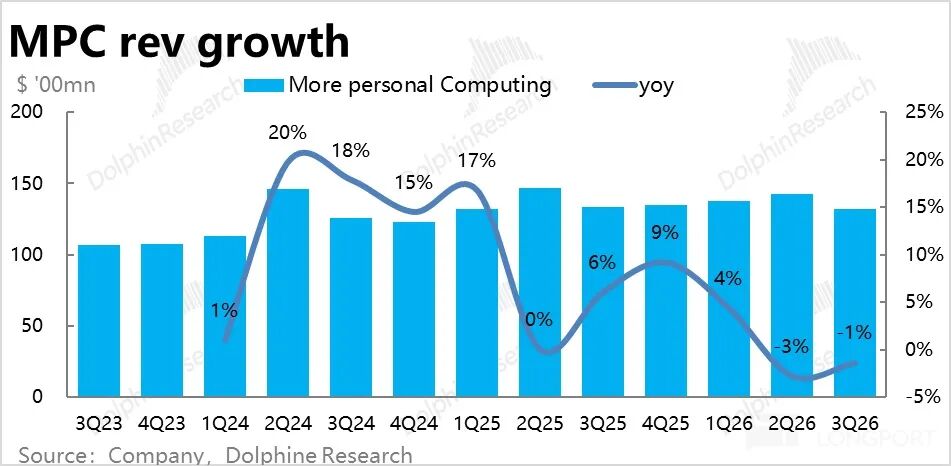
4. Personal business remains sluggish but exceeds low expectations: Growth in the Personal segment remained lackluster this quarter, with revenue declining by -1% YoY. However, this was not as severe as the previously projected -5%, surpassing low expectations.
This was primarily due to a 2.5% decline in Windows and hardware revenue, rather than the previously anticipated 10% decline. This aligns with market research indicating that actual PC shipments grew by 2%-4% YoY in the first quarter—not as dire as feared.
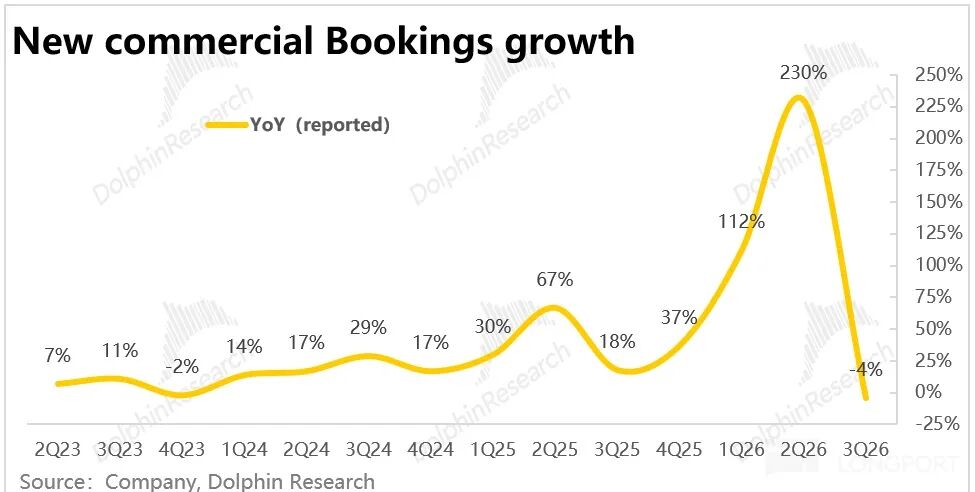
5. OpenAI order shifts? New contract growth turns negative: The value of newly signed enterprise contracts declined by 4% YoY this quarter, a stark contrast to the 230% YoY surge in the previous quarter. We believe this is primarily due to the impact of OAI no longer placing substantial new orders with Microsoft after renegotiating their cooperation agreement. Excluding OAI orders, new order value grew by approximately 7% YoY this quarter.
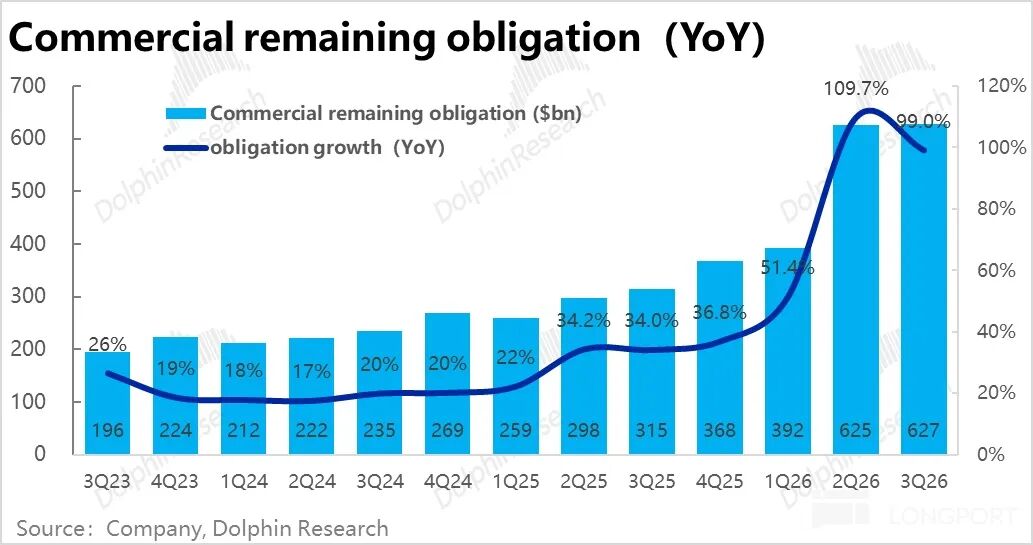
Similarly, the company disclosed that the remaining performance obligation (RPO) for enterprise contracts was $627 billion, up only $2 billion sequentially. Excluding OAI orders, RPO grew by 29% YoY, according to the company.
It is evident that after 'losing' OAI as a major client, Microsoft is struggling to secure new orders.
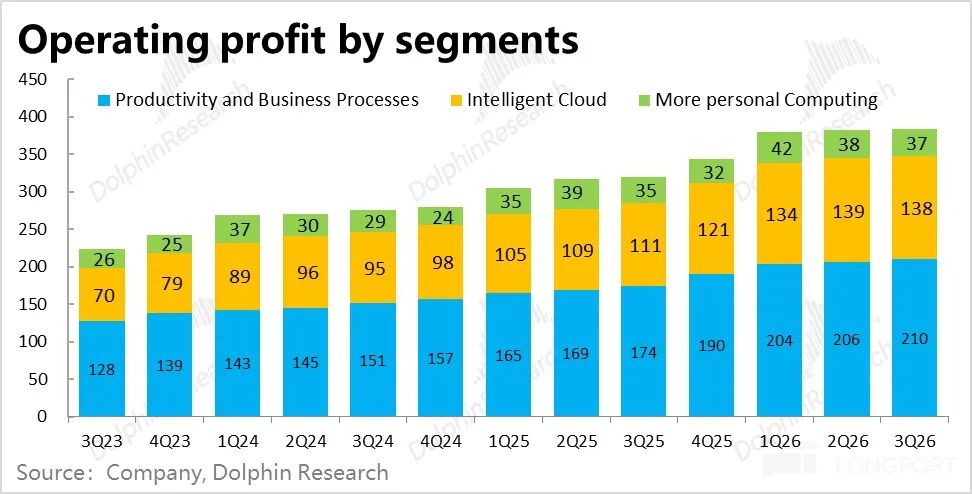
6. Profits remain unimpressive: The overall operating profit for the quarter was $39.4 billion, up 20% YoY. This seemingly significant increase, higher than revenue growth, indicates continued margin expansion. However, excluding currency tailwinds, actual operating profit growth was 16%, only marginally outpacing revenue growth of 15%, meaning margins remained roughly flat YoY.
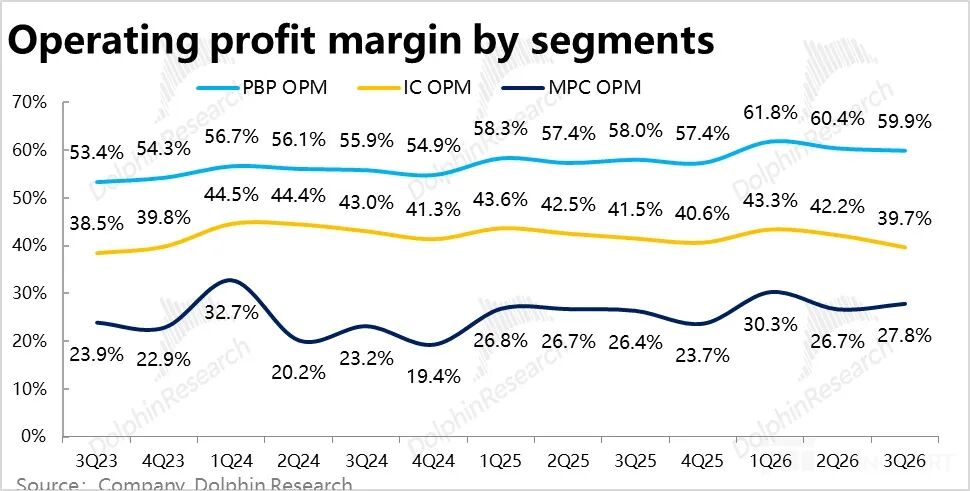
By segment, the operating margin of the Intelligent Cloud segment was 39.7%, down 1.8 pcts YoY, with the decline widening significantly from the 0.3 pct drop in the previous quarter. This reveals increasing margin pressure from Capex investments in the cloud segment. In contrast, operating margins in the Productivity Processes and Personal Computing segments saw slight improvements this quarter, excluding currency tailwinds.
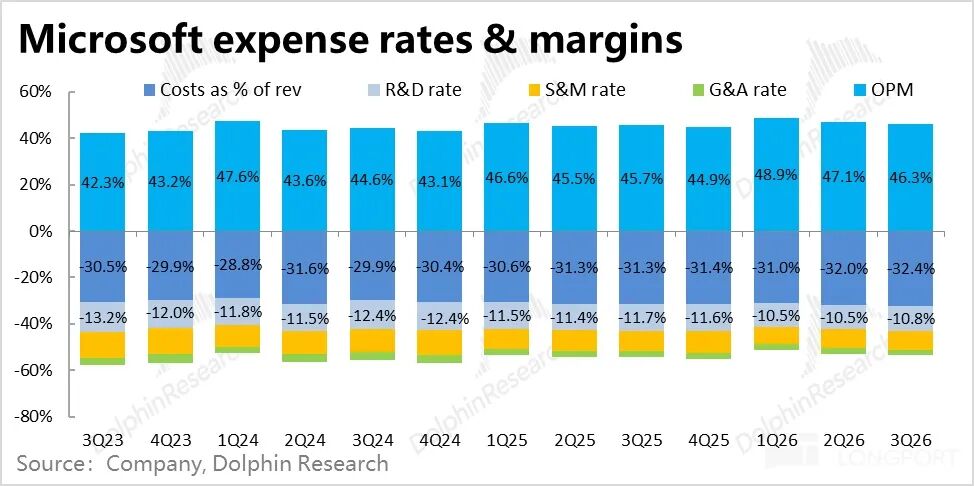
7. Gross margin pressure mounts, with expenses attempting to offset: The overall gross margin for the quarter was 67.6%, down 1.1 pcts YoY, with the decline widening from the previous quarter (0.7 pct). This was entirely due to margin contraction in the Intelligent Cloud segment (down a full 5 pcts YoY), while margins in the other two segments remained flat or slightly improved.
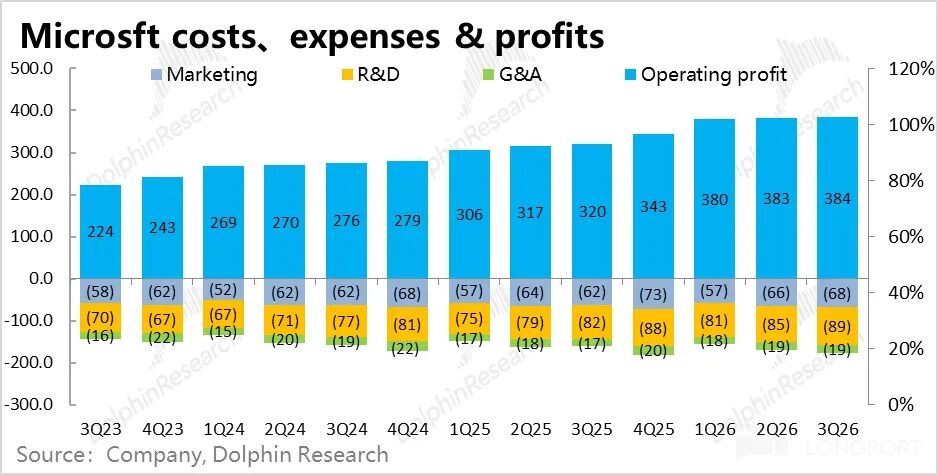
This quarter, margin pressure was primarily mitigated by expense control, with total operating expenses growing just 9.4% YoY (or 8% excluding currency impacts), well below revenue growth. This reduced the expense ratio by about 1.7 pcts YoY. However, expense growth accelerated significantly this quarter from 5% in the previous quarter, mainly due to increased marketing and administrative expenses.
Dolphin Research's Perspective:
1. Stability first, but lacking highlights: Overall, Microsoft's quarterly performance can be characterized as unremarkable—while generally exceeding expectations, it lacked significant standout features. In a competitive landscape where 'not advancing is retreating,' Microsoft's average performance compared to key rivals Google and Amazon can largely be equated to underperformance.
For Dolphin Research, several valuable and unexpected insights from this earnings report include: a) the significant and immediate impact of the downgrade in cooperation with OpenAI on securing new orders; b) the Intelligent Cloud segment's gross margin declining a full 5 pcts YoY, much worse than the decline in AWS's margins.
2. Guidance points to Azure growth improving:
1) First, the company projected next quarter's total revenue growth to be in the 13%-15% range, with currency tailwinds easing to 1 pct. At the upper end of the guidance (i.e., 14% growth at constant currency), this would represent a further 1 pct slowdown from this quarter.
Within this, Azure's growth at constant currency is projected at 39%-40%, indicating it would hold steady or continue to accelerate slightly from this quarter, continuing the positive trend but with only 'minor' improvement. Meanwhile, the company expects Azure's growth to continue improving in the second half of FY26—a positive direction but one that requires monitoring the actual extent of acceleration.
Dolphin Research believes this guidance is likely achievable, given the substantial Capex increases to follow and the company's stated intention to dynamically optimize and increase compute supply to 3P businesses.
Revenue growth guidance for the Productivity segment is centered at 12%, roughly in line with expectations. However, guidance for the Personal Computing segment seems overly conservative, implying a 10% YoY revenue decline, significantly below expectations.
2) Regarding profits, at the upper end of the company's guided range (about $38.8 billion in operating profit), this falls below market expectations of $39.3 billion. The implied profit growth at the upper end is 13%, lagging revenue growth, all pointing to greater margin pressure next quarter than this quarter.
At the midpoint of guidance, the implied overall operating margin of 44% would be down 0.9 pcts YoY, reflecting expected cost pressures—guidance calls for costs to grow 22%-23% YoY (including about 1.2 pcts in restructuring expenses), significantly higher than revenue growth. Expense growth is expected to remain low at around 7%.
3. Transformation pains become more evident:
From historical performance over the past few years, Microsoft's investment thesis has, in fact, been closely tied to its cooperative relationship with OpenAI. However, since Microsoft and OpenAI renegotiated and signed a new cooperation agreement in October 2025 (discussed in detail in our previous earnings review, 'After Parting Ways with OpenAI, Is Microsoft Still Attractive?'), there have been new developments in their relationship in recent days, including:
a) Microsoft no longer exclusively holds the rights to distribute and use OpenAI's products and models—Amazon has also been granted these rights.
b) Microsoft remains OAI's 'primary' compute supplier, but OpenAI is clearly reducing its reliance on Microsoft by placing more new orders with other partners such as Oracle, Amazon, and CoreWeave.
c) Microsoft can still use OpenAI's models and other intellectual property (IP) rights until 2032 and no longer needs to share revenue with OpenAI when distributing OpenAI IP, which will provide some margin benefit for Microsoft.
d) Conversely, OpenAI's revenue sharing with Microsoft (as a shareholder) will terminate in 2030, and a new maximum cumulative cap on sharing has been agreed (not disclosed).
It can be said that one of the key reasons for Microsoft's recent underperformance is the downgrade in its cooperation with OpenAI—leading to Azure's growth hitting a bottleneck in the short term and, in the medium-to-long term, causing Microsoft to lose the large model advantage provided by exclusive access to OpenAI among its three core capabilities (large models + cloud + chips), while also lacking an edge in Application-Specific Integrated Circuit (ASIC) chips.
Thus, compared to Google, which excels in all three areas, and Amazon, which has cloud + chip capabilities, Microsoft has become the least competitive. Therefore, Microsoft faces high urgency to develop a 'decent' large model or ASIC chip in-house.
Another issue is that as AI's development direction shifts—from primarily targeting consumer (C-end) users and monetizing through e-commerce, advertising, etc., to primarily targeting enterprise (B-end) users and monetizing through improving work efficiency—the main industries threatened by AI have also changed from search, e-commerce, Online Travel Agency (OTA), etc., to work software industries.
Therefore, not only has Microsoft's cloud business seen a weakening in overall competitiveness, but its Productivity Processes segment has even become a potential victim that could be replaced by AI. These are major issues in Microsoft's current investment thesis.
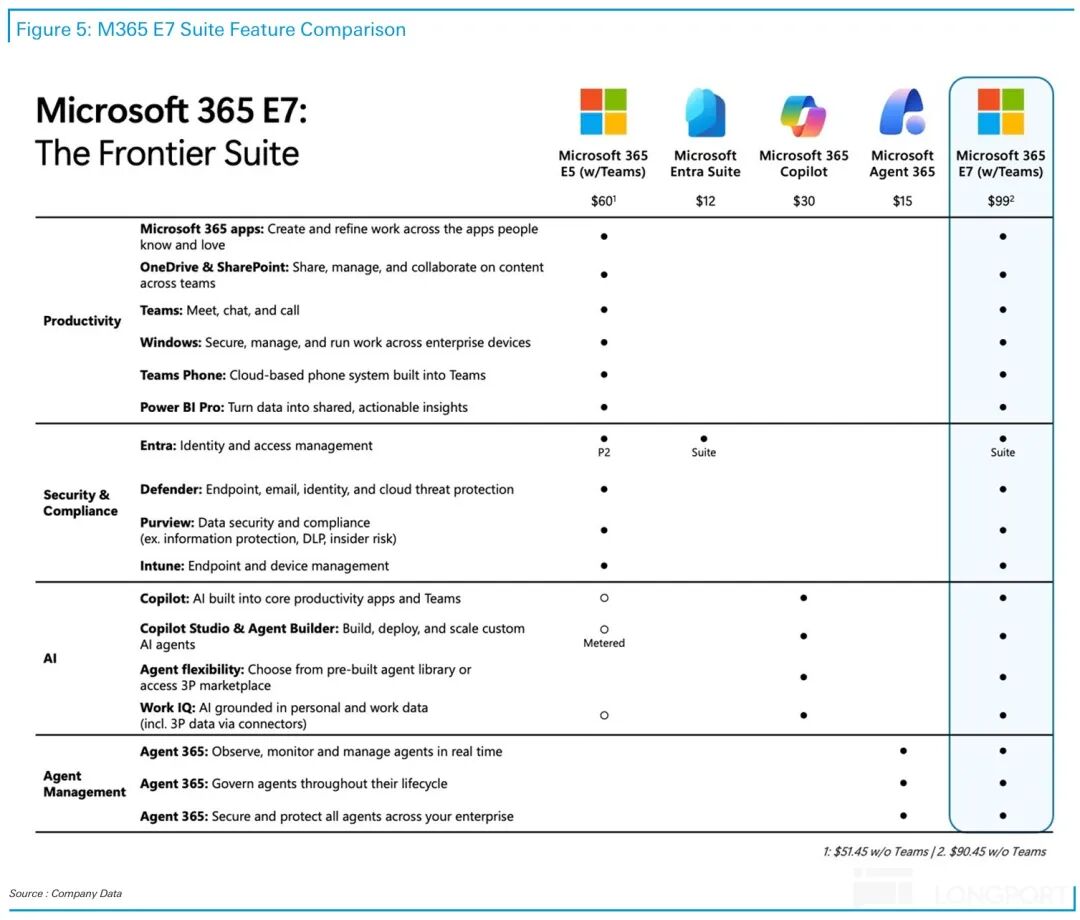
4. Microsoft's response measures: Clearly, Microsoft is not sitting idle. In addition to the long-term measures mentioned earlier—increasing Capex investments and allocating more compute to Azure for revenue generation, as well as striving to develop large models and improve ASIC chips in-house—Microsoft has taken an immediately effective step by launching the M365 E7 suite above its previous top-tier E5 suite.
In addition to including all E5 features, E7 incorporates built-in Copilot, Agent 365, Entra, and other add-ons. The base pricing increases from $60 for E5 to $99 for E7, representing a price hike of over 1/2.
Besides introducing E7, Microsoft will also implement across-the-board price increases for its other existing products starting July 1, with specific details shown in the figure below.
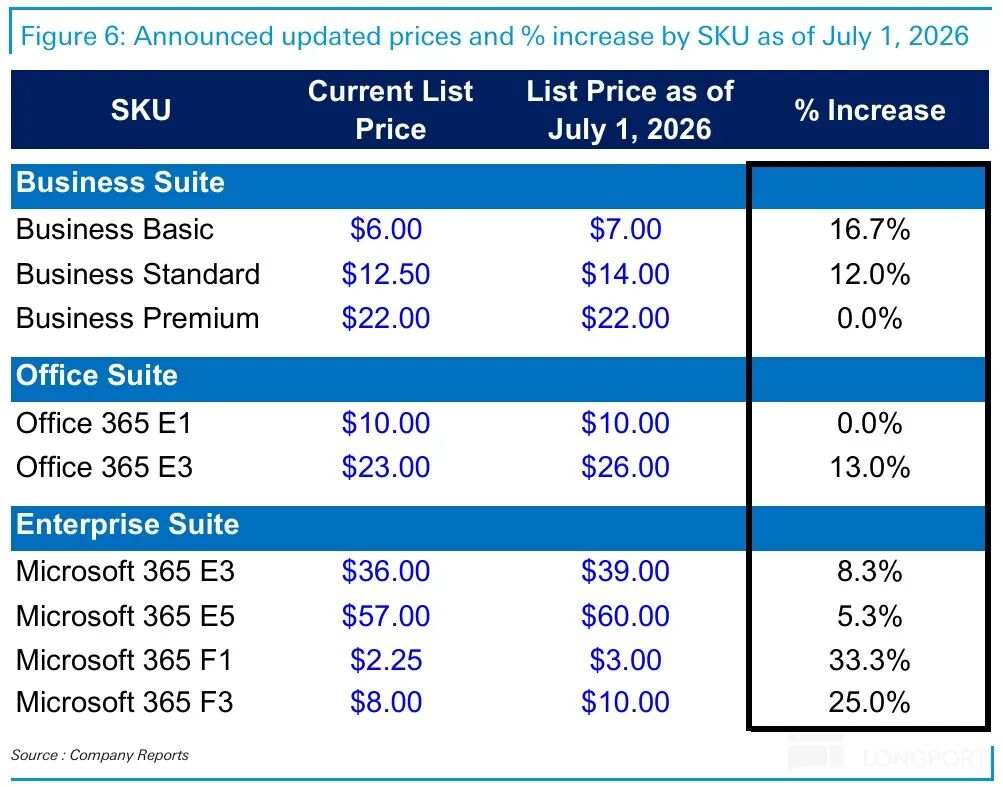
A more detailed value analysis has been published in the same-named article in the 'Insights - Deep Dive' section of the Changqiao App.
Below is a detailed review of the financial report:
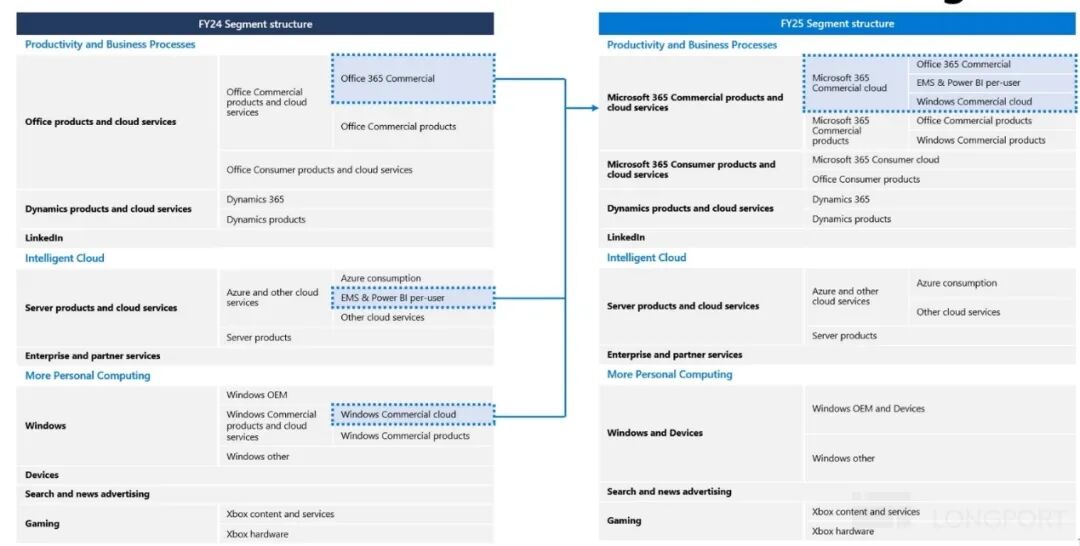
I. Overview of Changes in Financial Reporting Disclosure
Starting in FY25, Microsoft made significant adjustments to its financial reporting segment structure. The overall approach was to consolidate all enterprise-oriented 365 services, including Commercial Office 365, Windows 365, and Security 365, from their original segments into the Productivity & Processes (PBP) mega-segment. For specific changes and Dolphin Research's perspectives, please refer to our 1Q25 review. The figure below provides a brief summary and will not be elaborated further.
II. Segment Performance: All Slightly Better Than Expected but Lacking Highlights
1.1 Azure growth stabilizes but still relatively underperforms
The most closely watched core business, Azure, saw revenue grow 40% YoY this quarter, or 39% excluding currency impacts, accelerating slightly by 1 pct from the previous quarter and meeting market expectations. This marks a small improvement after Azure's prior growth slowdown but still underperforms compared to the significant acceleration seen in AWS and GCP this quarter.
Dolphin Research believes the main reasons are the further unbundling of Microsoft's cooperation with OpenAI and OAI shifting some compute orders to other CSPs.
Of course, the company's stated priority of allocating more compute to 1P proprietary businesses and internal R&D, resulting in insufficient capacity for external leasing, should also be a factor. After all, with OAI no longer bound to Microsoft and potentially becoming direct competitors, Microsoft has a pressing need to develop a 'first-tier' large model in-house.
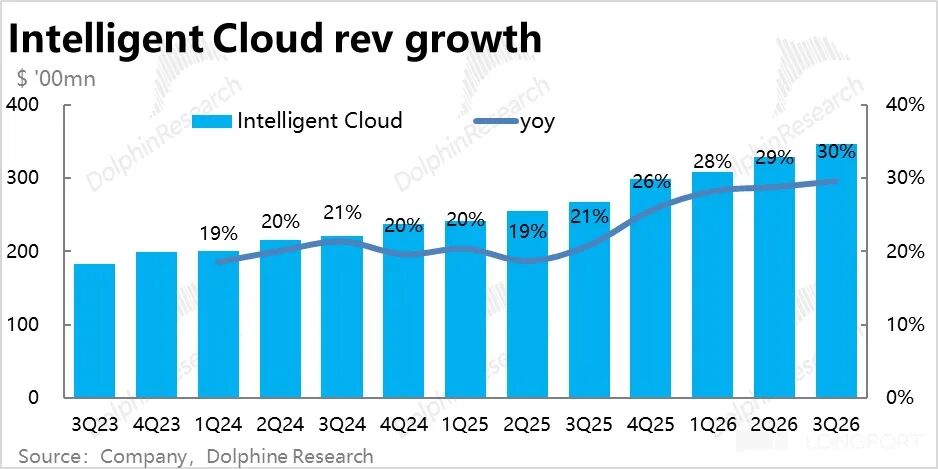
Meanwhile, revenue in the overall Intelligent Cloud segment grew about 30% YoY this quarter, also accelerating slightly by 1 pct sequentially but mainly due to currency tailwinds.
1.2 The growth of the Productivity segment has slowed down steadily, still driven by price increases.
This quarter, revenue from Microsoft's second-largest business segment, Microsoft 365 Commercial Cloud, rose by 19%, marking an acceleration of 2 percentage points (pct) from the previous quarter. Yet, when adjusting for exchange rate fluctuations, the actual sequential revenue growth decelerated to just 1 pct.
Analyzing the price and volume dynamics, the number of commercial M365 subscription seats increased by 6% year-over-year (YoY) this quarter, maintaining the same growth rate as the previous quarter. Consequently, the acceleration in growth this quarter was entirely attributable to a 12% YoY increase in average revenue per user (ARPU), likely driven by improvements in the product mix (e.g., upgrades from E3 to E5) or the impact of additional subscriptions (e.g., Copilot).
However, overall, since Office 365's revenue growth has not significantly accelerated, it can be inferred that value-added services like Copilot have not yet seen widespread adoption.
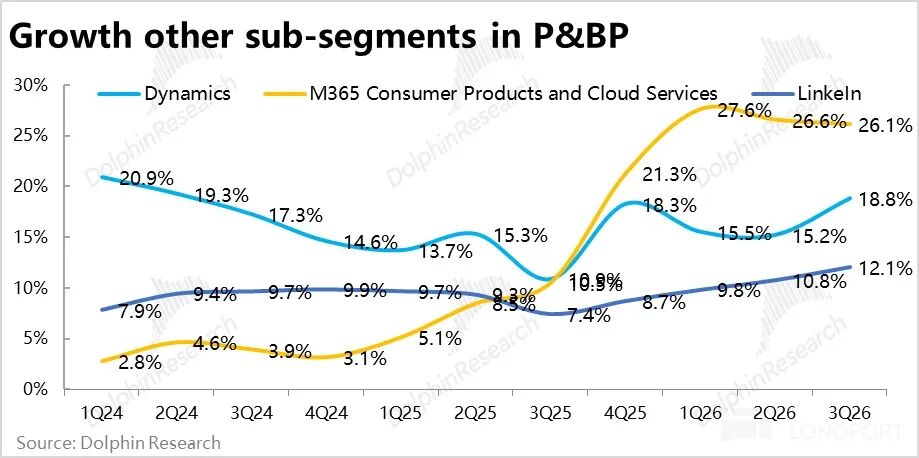
Within the Productivity segment's other businesses, Dynamics 365 experienced a 22% growth rate, a notable acceleration from the previous quarter. However, this was primarily due to favorable exchange rates, as the growth rate at constant exchange rates was 17%, unchanged from the previous quarter. LinkedIn continued to exhibit sluggish growth, with a 9% increase at constant exchange rates this quarter, decelerating by another 1 pct from the previous quarter.
Due to previous price hikes, the consumer M365 business sustained revenue growth of approximately 26% this quarter, with a 7% YoY increase in the user base, up by 1 pct from the previous quarter. However, it's worth noting that these price increases began in the fourth quarter of the last fiscal year, so the favorable cycle of price increases will conclude by the next quarter (unless new price increases are implemented).
Overall, after adjusting for exchange rate impacts, growth across various businesses within the Productivity Process segment remained generally stable or slightly decelerated. Therefore, the overall growth rate of the Productivity segment, excluding exchange rate impacts, was 13%, decelerating slightly by 1 pct from the previous quarter.
1.3 Personal Business: Underperformance Across the Board, but Not as Dire as Anticipated
The personal segment's growth remained sluggish this quarter, but it significantly outperformed the overly pessimistic guidance previously provided. Actual revenue declined by -1% YoY, compared to the market expectation of -5%.
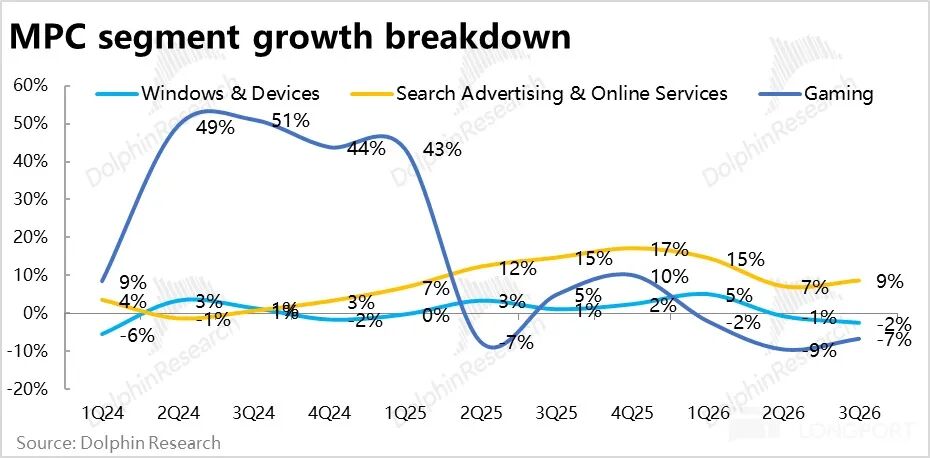
Specifically: 1) The businesses that exceeded expectations were primarily Windows systems and hardware, with actual revenue declining by only 2.5%, compared to the overly conservative guidance of -10%, broadly in line with market research data.
2) Advertising revenue, excluding traffic acquisition costs, grew by 12%, or 9% after adjusting for exchange rates, unchanged from the previous quarter. However, advertising revenue growth remained above 20% year-to-date.
3) In the gaming segment, sales of Xbox consoles and other hardware performed poorly, with revenue declining by 33% YoY, while gaming content also decreased by 5%, showing similarly lackluster performance.
IV. Lost OpenAI as a Major Customer? New Order Amount Declines YoY
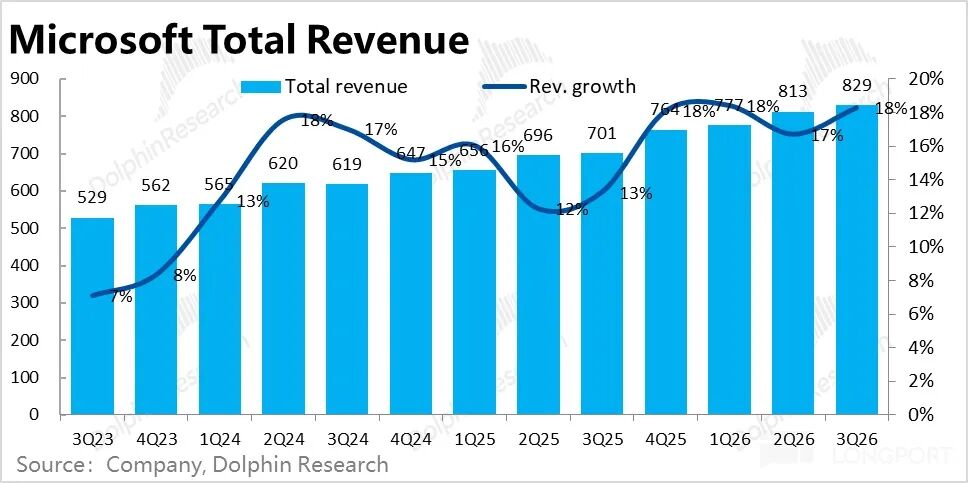
Summarizing the performance of each segment above, Microsoft's total revenue for the quarter was $82.9 billion, up 18% YoY, slightly surpassing the sell-side consensus expectation of 16.3%. However, after adjusting for exchange rate impacts, the actual revenue growth rate was 15%, broadly in line with the previous quarter. Overall, there were no significant growth bright spots across segments this quarter.
In contrast, there were intriguing changes in leading indicators this quarter. First, the value of new enterprise contracts signed this quarter declined by 4% YoY, a stark contrast to the 230% YoY surge in the previous quarter. The underlying reason is that after Microsoft and OpenAI (OAI) renegotiated their partnership agreement, OAI no longer placed large new orders with Microsoft. According to disclosures, excluding the impact of OAI orders, the value of new orders signed this quarter increased by approximately 7% YoY.
Similarly, the company disclosed that the remaining performance obligation (RPO) for enterprise contracts was $627 billion, increasing by only $2 billion sequentially. According to the company, excluding OAI's orders, RPO grew by 29% YoY, while including OAI's orders, it grew by 99% YoY.
From these two indicators, it is evident that after "losing" OAI as a major customer, there has been a significant impact on Microsoft's ability to secure new orders. We believe this is also one of the main reasons for the slightly sluggish growth of Azure in recent quarters.
V. Capex Investment Slows Down, Aligning with Azure's Growth Pace
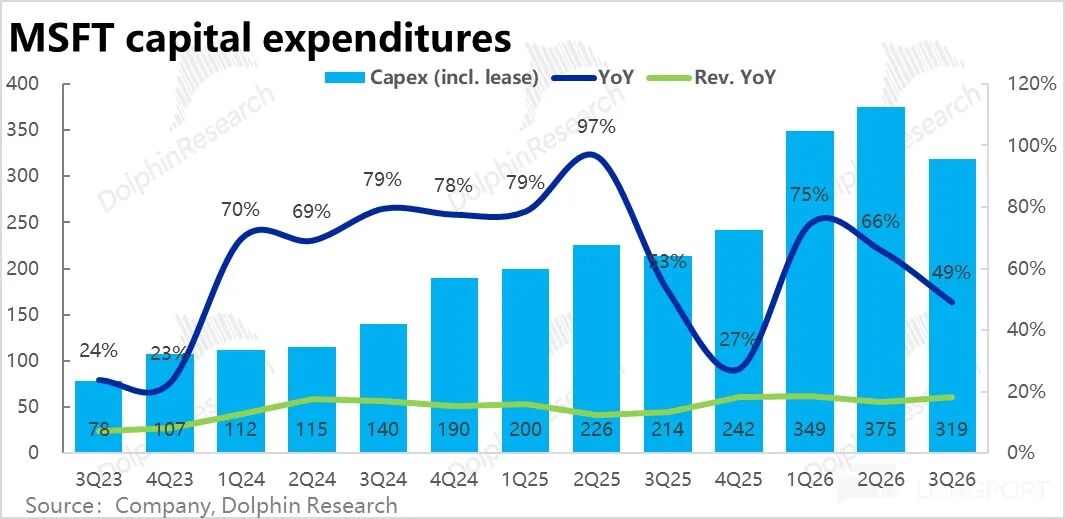
Microsoft's actual Capex (including leases) expenditure this quarter was $31.9 billion, no longer increasing sequentially but instead decreasing by over $5 billion, also falling short of the market expectation of $35 billion. We believe the decline in Capex expenditure this quarter reflects the further downgrade of the partnership with OAI and the expectation of reduced order volumes from OAI in the future.
In terms of structure, equipment with short lifespans, such as GPUs/CPUs, accounted for 2/3 of the expenditure. Overall, the reduction in Capex expenditure broadly corresponds to the recent changes in Azure's growth rate. Therefore, as the company expects Azure's growth to accelerate in the second half of calendar year 2026, it guides for Capex to increase to $40 billion next quarter, with an even higher guidance of $190 billion for Capex expenditure in calendar year 2026.
VI. Gross Margin Pressure Intensifies, Expenses Strive to Offset
Compared to the relatively lackluster revenue performance, Microsoft's profit performance this quarter was slightly better, but still not particularly outstanding. 1) Overall operating profit for the quarter was $39.4 billion, up 20% YoY, significantly higher than revenue growth, indicating that profit margins continued to rise. However, after adjusting for exchange rate impacts, the actual operating profit growth rate was 16%, only slightly outpacing the 15% revenue growth rate at constant exchange rates, meaning profit margins remained broadly flat YoY.
2) By segment, the operating profit margin of the Intelligent Cloud segment, which is the most closely watched and bears the brunt of Capex and depreciation, was 39.7%, down 1.8 pct YoY, with a more significant decline compared to the 0.3 pct drop in the previous quarter. This shows that Capex investment is increasingly putting pressure on the profit margins of the cloud segment.
Meanwhile, the operating profit margins of the Productivity Process and Personal Computing segments both saw slight improvements this quarter after adjusting for exchange rate impacts.
3) From a cost and expense perspective, the overall gross margin this quarter was 67.6%, down 1.1 pct YoY, with the decline widening compared to the previous quarter (0.7 pct). This was entirely due to the drag from the decline in the gross margin of the Intelligent Cloud segment (down a full 5 pct YoY), while the gross margins of the other two segments remained flat or slightly improved.
2) Despite the widening decline in gross margins, the company still primarily relied on cost control to offset margin pressure this quarter, with total operating expenses growing by only 9.4% YoY (8% after adjusting for exchange rate impacts). This remains significantly lower than revenue growth, causing expense ratios to decline by approximately 1.7 pct YoY. However, on a sequential basis, expense growth accelerated significantly this quarter compared to the 5% in the previous quarter, primarily due to increases in marketing and administrative expenses. This was also partly due to the low base effect from the previous year.
- END -
// Reprint Authorization
This article is an original work by Dolphin Research. Reproduction is prohibited without authorization.
// Disclaimer and General Disclosure
This report is intended solely for general informational and data reference purposes for users of Dolphin Research and its affiliated institutions. It does not take into account the specific investment objectives, investment product preferences, risk tolerance, financial status, or special needs of any individual receiving this report. Investors must consult with independent professional advisors before making investment decisions based on this report. Any person making investment decisions using or referring to the content or information in this report does so at their own risk. Dolphin Research shall not be liable for any direct or indirect responsibilities or losses that may arise from the use of the data contained in this report. The information and data in this report are based on publicly available sources and are for reference purposes only. Dolphin Research strives to ensure but does not guarantee the reliability, accuracy, and completeness of the information and data.
The information or opinions mentioned in this report shall not, under any jurisdiction, be construed as or deemed to be an offer to sell securities or an invitation to buy or sell securities, nor shall they constitute recommendations, inquiries, or endorsements of relevant securities or related financial instruments. The information, tools, and materials in this report are not intended for or intended to be distributed to jurisdictions where distribution, publication, provision, or use of such information, tools, and materials contradicts applicable laws or regulations, or to citizens or residents of jurisdictions where Dolphin Research and/or its subsidiaries or affiliated companies are required to comply with any registration or licensing requirements in that jurisdiction.
This report only reflects the personal views, opinions, and analytical methods of the relevant creators and does not represent the stance of Dolphin Research and/or its affiliated institutions.
This report is produced by Dolphin Research, and the copyright is solely owned by Dolphin Research. No institution or individual may, without the prior written consent of Dolphin Research, (i) make, copy, reproduce, duplicate, forward, or distribute in any form copies or replicas in any way, and/or (ii) directly or indirectly redistribute or transfer to other unauthorized persons. Dolphin Research reserves all relevant rights.
-
![]()
Tesla Restructures Its Balance Sheet
-
![]()
Accelerating the High-Speed Interconnection Upgrade of AI Computing Clusters! JONHON Releases ELSFP External Light Source Optical Connectors
-
![]()
Breaking the overseas blockade of volumetric holographic materials, this optical enterprise secures nearly 100 million yuan in financing!
-
![]()
Why Does Jensen Huang So Openly Praise China’s AI?
-
![]()
"Wudang" Unveiled: Arm China's Next-Gen AI VPU Redefines Video Encoding
-
![]()
From Energy Conservation and Carbon Reduction to AI Decision-Making: GECON East Intelligence and Chery Group Explore a New Green and Smart Paradigm for Automobile Manufacturing
-
![]()
WAIC 2026 Observation | AI Accelerates Towards the Core of Industries, Industrial AI Enters a Critical Phase
-
![]()
Volkswagen China Fires the First Shot in Foreign-Funded 'White Box Delivery'!