Unity Stabilizes Amid AI Disruption Concerns
 05/11 2026
 585
585
Greetings, readers! This is Dolphin Research speaking.
Unity has just released its Q1 financial results. Given that a preliminary preview was shared at the end of March, our focus now shifts to the guidance provided, particularly in light of the divestiture of IronSource. This move is crucial as it more accurately reflects the growth trajectory of Unity's Vector advertising system.
Let's delve deeper:
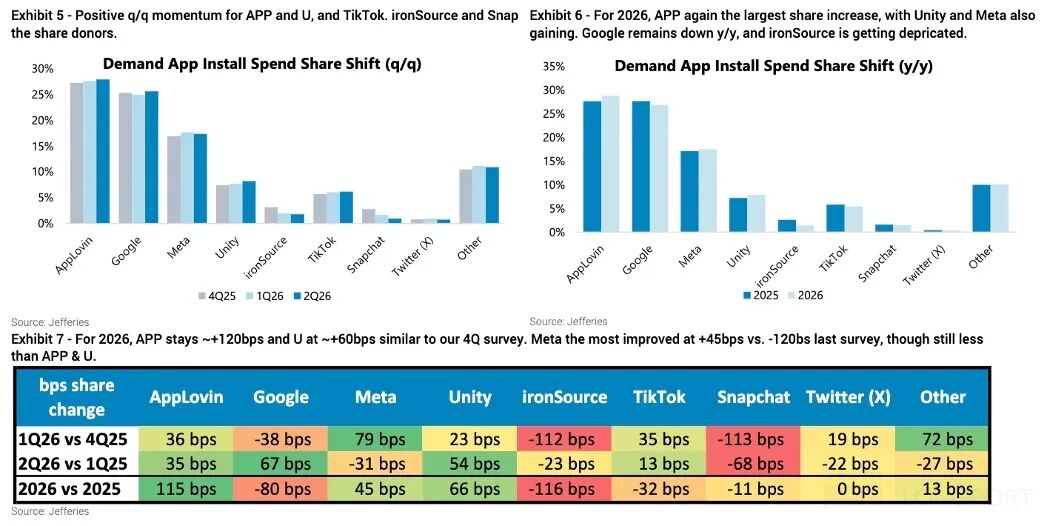
1. Guidance Surpasses Expectations, Vector Shows Positive Momentum
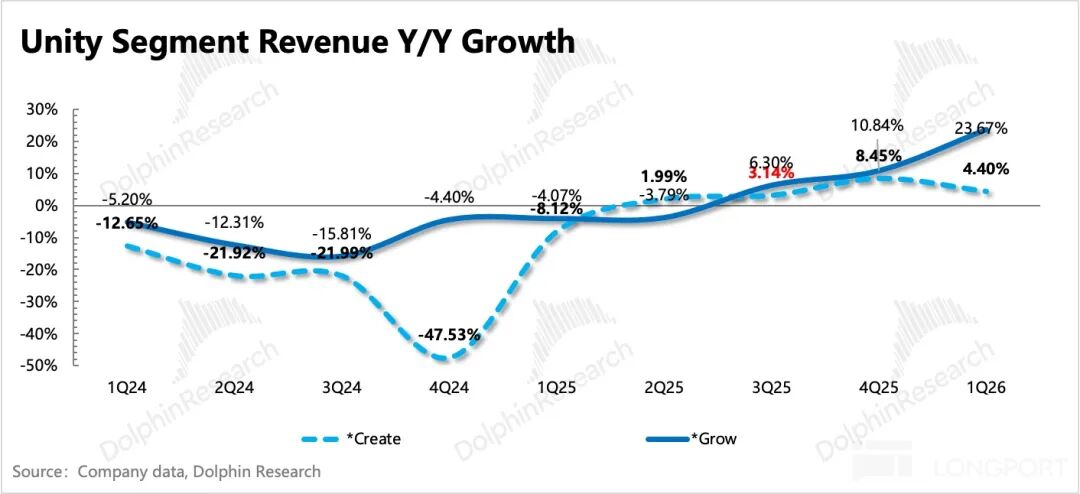
Management anticipates a Q2 revenue growth of 15%-17%. Excluding the core strategic business revenue from IronSource and Supersonic, the projected growth stands at 29%-32%. The strategic Grow business, when calculated at the upper end of the guidance, indicates a 10% QoQ increase in Q2, with Vector expected to contribute significantly, growing by over 10% (in line with Dolphin Research's forecasts).
Further growth is anticipated, driven by enhanced customer penetration through the D28 algorithm, data integration from the Runtime engine, and the post-Q2 launch of the In-App Commerce platform. Given the intensifying competition, management's outlook on Vector's long-term growth trend is pivotal. Investors should keep an eye out for more detailed metrics disclosed during the earnings call.
The Create business's growth rate has slightly decelerated due to a higher base. In January, Unity Pro/Enterprise subscription prices rose by 5%, but a wave of free cloud storage upgrades in March is expected to maintain customer loyalty despite the price increase.
2. A Pleasant Surprise: Significant Margin Improvement
Unity has grappled with internal operational inefficiencies in recent years, a challenge that cannot be ignored. Compared to its competitor Applovin, Unity's larger workforce has not translated into higher revenue.
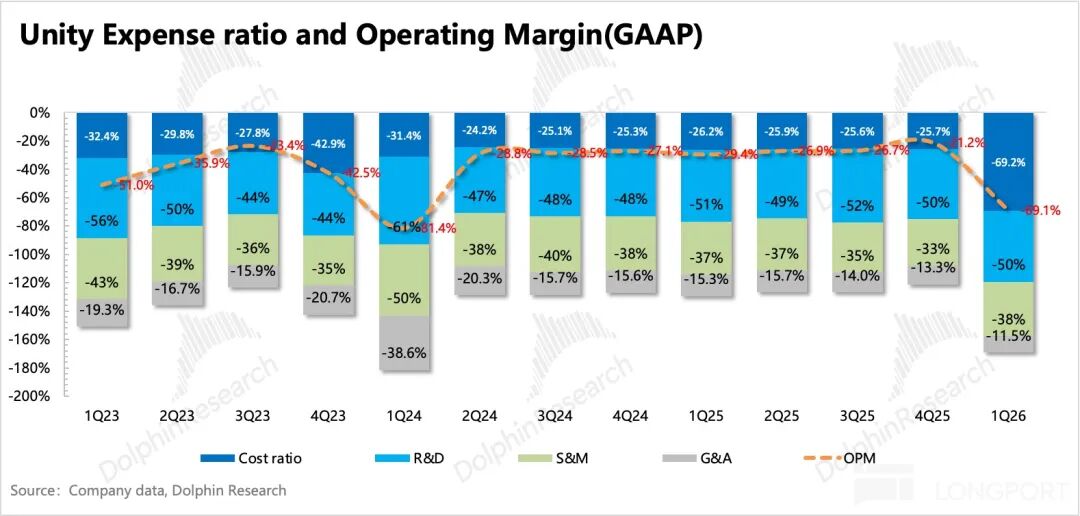
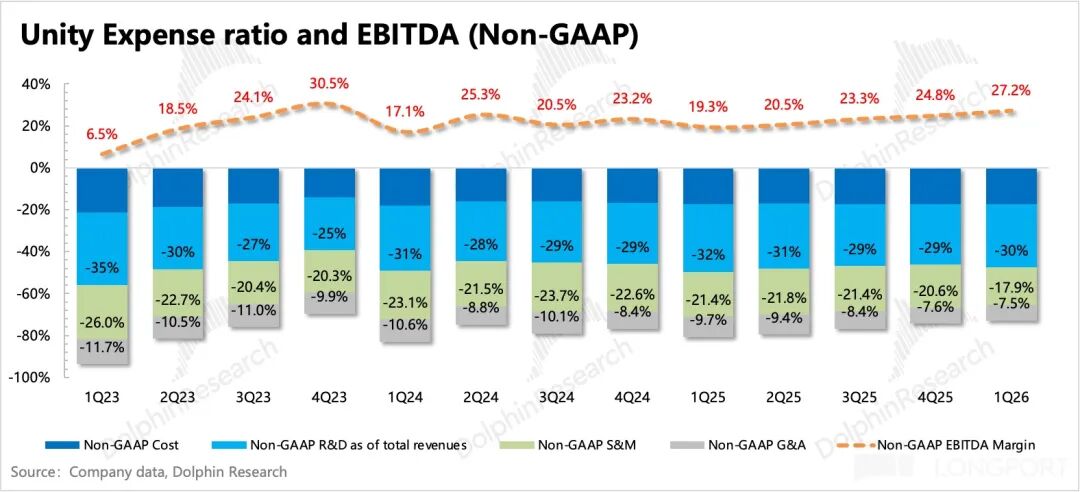
While the primary blame lies with the acquisitions made by the previous management, three years have elapsed since the new management took charge in 2023. The slow pace of business integration suggests that the new team also faces operational challenges. Therefore, the Q1 adjusted EBITDA margin (excluding SBC, depreciation, amortization, and the impact of Ironsource's divestiture and restructuring) improving to 27%, showing significant year-over-year and quarter-over-quarter optimization, has somewhat boosted Dolphin Research's confidence in the financial report.
3. Navigating the Recovery Amid AI Disruption Theories
The AI disruption theory has been a topic of discussion for nearly a quarter. With the valuation重心 (center of gravity) of software stocks shifting downward and being further digested by consistently strong performance that exceeds expectations, the short-term impact of disruption theories has now diminished. Unity's current market capitalization of $11.7 billion falls within the first safe range of $9.9 billion to $11.8 billion previously calculated by Dolphin Research (refer to the March 27, 2026, Unity Q1 Performance Preview Review on Changqiao App).
Overall, it roughly aligns with this year's performance, with a valuation equivalent to 21x adjusted EV/EBITDA, which is slightly less cost-effective compared to Applovin within the foreseeable performance range. Furthermore, from a GAAP and cash flow perspective, Unity's valuation is also weaker than Applovin's (with SBC and depreciation costs accounting for a significant proportion).
However, in the above valuation, when considering the engine business, we used a relatively conservative 3-4x P/S to reflect investment sentiment under the AI erosion and disruption theory. Therefore, the potential for further upward revision stems from the expectation gap herein.
Additionally, there are expectations for Vector to deliver higher effectiveness, materializing in a trend of quarter-over-quarter growth of 10%, exceeding Dolphin Research's expectations. Short-term institutional research indicates a positive trend for Vector, but the pace of effectiveness improvement is still not rapid enough to sufficiently motivate clients to switch from competitors to its own platform.
4. Performance Metrics Overview
Below are detailed charts:
I. Basic Introduction to Unity's Business
Unity incorporated IronSource's operating results in Q1 2023 and adjusted the scope of its segmented business. Under the new disclosure structure, the segmented businesses are condensed from the original three (Create, Operate, Strategic) into two (Create, Grow).
The new Create solution encompasses not only the products under the original Create (the main game engine) but also incorporates revenue from UGS (Unity Game Service: a comprehensive solution for game companies, aiding in game development, distribution, and customer acquisition operations) that was previously confirmed under Operate, as well as revenue from the original Strategy. However, products and services such as Professional service and Weta will be gradually phased out starting in 2023.
The Grow solution includes the advertising business from the original Operate, as well as marketing (mainly Aura, with Luna closing in Q1 2024) and game distribution services (Supersonic) merged from IronSource. The revenue contribution comes from subscription revenue for seats of the main game development engine, revenue from the advertising platform responsible for matching bids, and game distribution revenue.
II. Detailed Charts
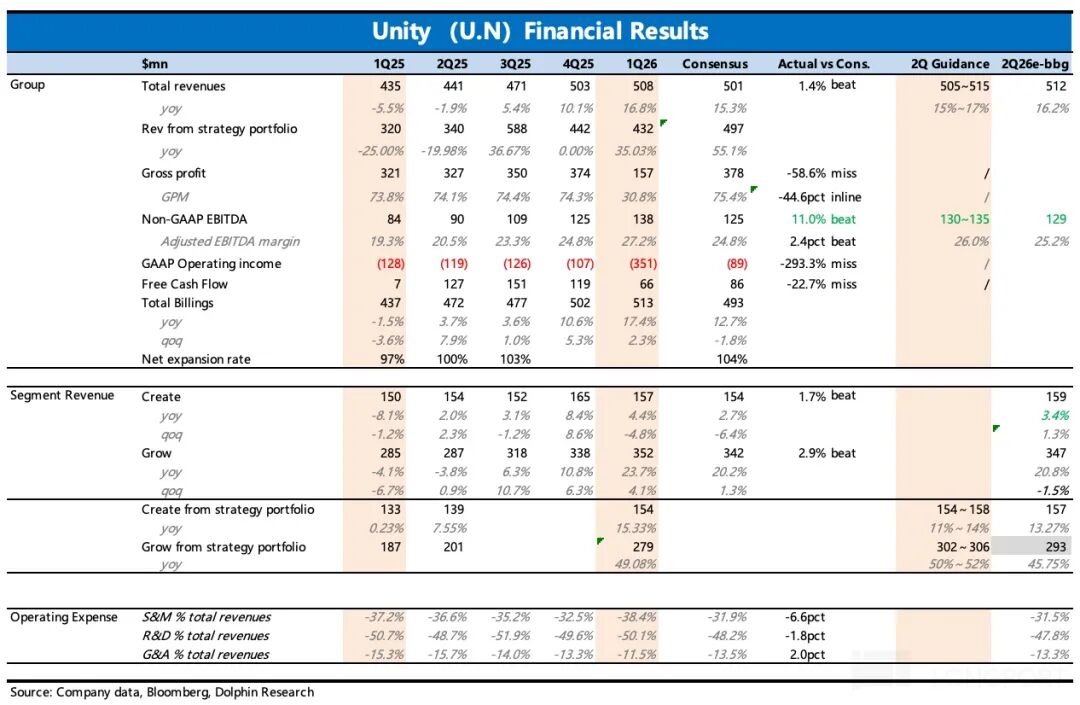
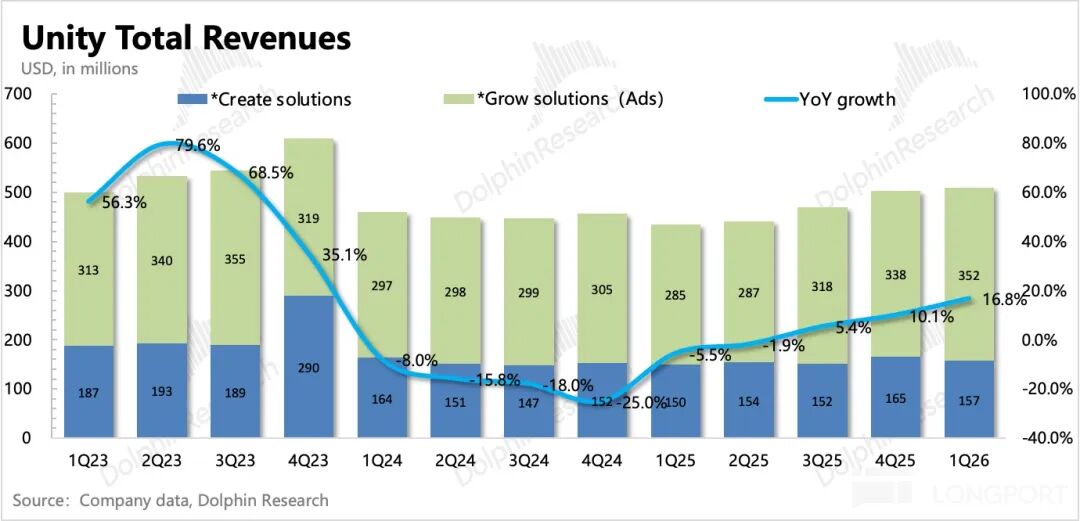
Unity achieved total revenue of $508 million in Q1, a 17% YoY increase, slightly exceeding company guidance and market expectations.
In terms of segmented business: Create business grew by 4%, while Grow business grew by 24%, with the latter showing significant acceleration.
Regarding management's guidance for short-term performance:
Q2 revenue and adjusted profit are slightly better than expected—revenue guidance is expected to be between $505 million and $515 million, a 15%-17% YoY increase; adjusted EBITDA is expected to be between $130 million and $135 million, also higher than expected. Considering the new management's cautious guidance style, the actual performance should be even better.
Q1 Non-GAAP EBITDA margin increased by nearly 3pct QoQ, mainly due to operational efficiency improvements after business focus. Cash flow weakened to $66 million QoQ due to some related expenditure compensation for business adjustments this quarter.
- END -
// Reprint Authorization
This article is an original piece by Dolphin Research. Reprinting is only allowed with authorization.
// Disclaimer and General Disclosure
This report is intended for general informational purposes only, providing comprehensive data for general reading and reference by users of Dolphin Research and its affiliated institutions. It does not take into account the specific investment objectives, investment product preferences, risk tolerance, financial status, or special needs of any individual receiving this report. Investors must consult with independent professional advisors before making investment decisions based on this report. Any person making investment decisions using or referring to the content or information mentioned in this report does so at their own risk. Dolphin Research shall not be liable for any direct or indirect responsibilities or losses that may arise from using the data contained in this report. The information and data in this report are based on publicly available materials and are for reference purposes only. Dolphin Research strives to ensure but does not guarantee the reliability, accuracy, and completeness of the information and data.
The information or opinions mentioned in this report shall not be considered or deemed as an offer to sell securities or an invitation to buy or sell securities in any jurisdiction, nor shall they constitute recommendations, inquiries, or endorsements of relevant securities or related financial instruments. The information, tools, and materials in this report are not intended for or proposed to be distributed to jurisdictions where distribution, publication, provision, or use of such information, tools, and materials contradicts applicable laws or regulations, or to citizens or residents of jurisdictions where Dolphin Research and/or its subsidiaries or affiliated companies are required to comply with any registration or licensing requirements in such jurisdictions.
This report only reflects the personal views, insights, and analytical methods of the relevant creators and does not represent the stance of Dolphin Research and/or its affiliated institutions.
This report is produced by Dolphin Research, and the copyright is solely owned by Dolphin Research. No institution or individual may, without the prior written consent of Dolphin Research, (i) make, copy, reproduce, duplicate, forward, or distribute in any form any copies or reproductions, and/or (ii) directly or indirectly redistribute or transfer to other unauthorized persons. Dolphin Research reserves all relevant rights.
-
![]()
Tesla Restructures Its Balance Sheet
-
![]()
Accelerating the High-Speed Interconnection Upgrade of AI Computing Clusters! JONHON Releases ELSFP External Light Source Optical Connectors
-
![]()
Breaking the overseas blockade of volumetric holographic materials, this optical enterprise secures nearly 100 million yuan in financing!
-
![]()
Why Does Jensen Huang So Openly Praise China’s AI?
-
![]()
"Wudang" Unveiled: Arm China's Next-Gen AI VPU Redefines Video Encoding
-
![]()
From Energy Conservation and Carbon Reduction to AI Decision-Making: GECON East Intelligence and Chery Group Explore a New Green and Smart Paradigm for Automobile Manufacturing
-
![]()
WAIC 2026 Observation | AI Accelerates Towards the Core of Industries, Industrial AI Enters a Critical Phase
-
![]()
Volkswagen China Fires the First Shot in Foreign-Funded 'White Box Delivery'!