Tesla: Rare Revenue Surge in Auto Business, AI Ambitions Delayed Again
 04/23 2026
 435
435
Tesla (TSLA.O) released its Q1 2026 earnings report after the U.S. market closed on April 22 (Beijing Time), delivering better-than-expected results in its automotive business amid widespread pessimism. Key highlights include:
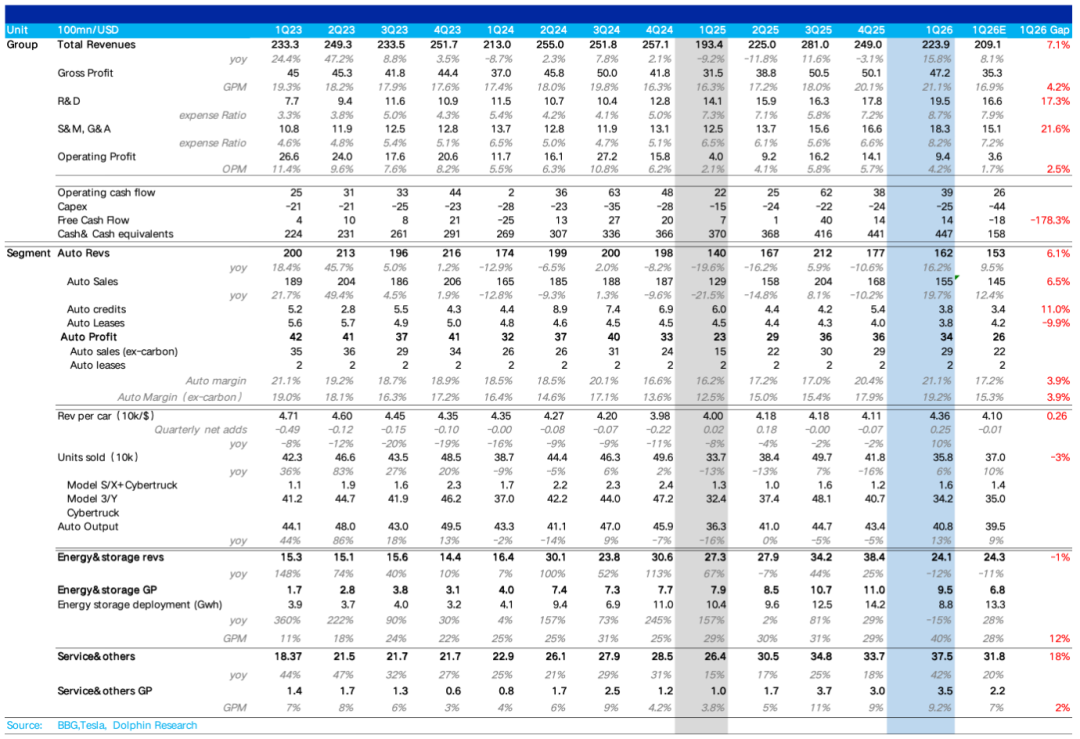
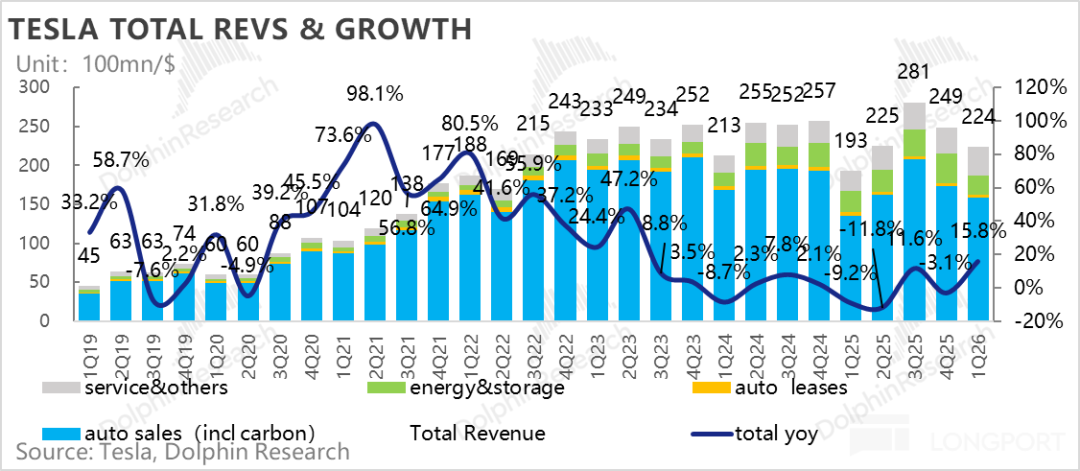
① Strong top-line performance: Total revenue hit $22.4 billion, up 16% YoY, significantly exceeding consensus estimates of $20.7-20.9 billion.
While this included ~$900 million in positive FX impact, adjusted revenue of $21.5 billion still topped expectations, primarily due to a rebound in average selling prices (ASPs) for vehicles, which offset a short-term decline in energy storage shipments and revenue (at $2.41 billion, down 12% YoY) caused by front-loaded demand in prior periods.
② Automotive revenue also surpassed expectations: Total automotive revenue reached $16.2 billion, beating market expectations of $15.3 billion. Core automotive sales revenue (excluding regulatory credits and leasing) hit $15.5 billion, exceeding the $14.5 billion forecast and serving as the primary driver of the upside.
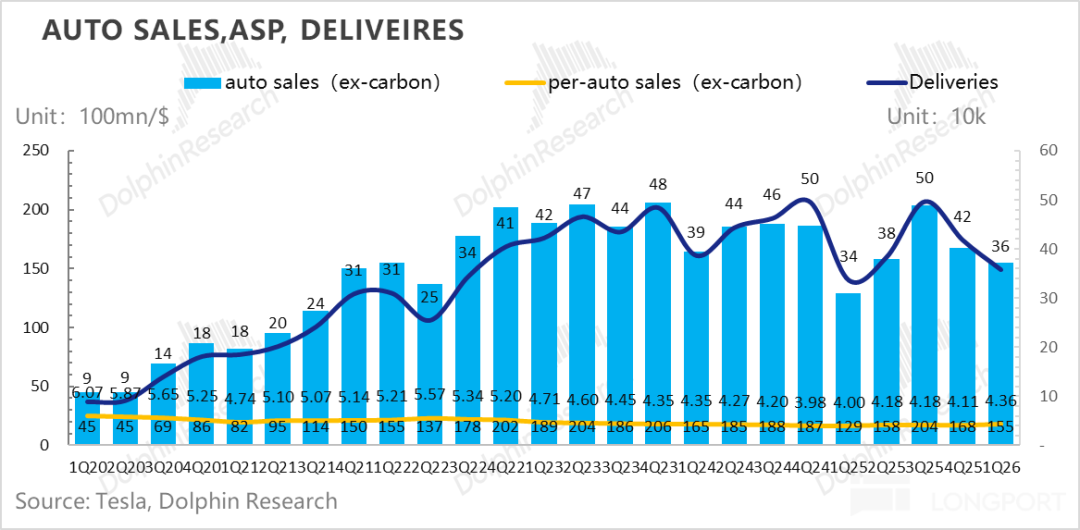
Despite Q1 delivery volumes of 358,000 units falling short of expectations and declining sequentially due to policy rollbacks in the U.S. and Chinese markets, ASPs rebounded sharply by $2,500 sequentially to $43,600, ending a prolonged decline. This was attributed to an improved product mix (higher share of premium Model S/X and Cybertruck at 5%), reduced promotional discounts in markets like the U.S., and record-high new FSD subscriptions following its full transition to a subscription model, which boosted high-margin software revenue.
③ Core automotive gross margin (excluding credits) showed resilience: Overall automotive gross margin reached 21.1%, well above consensus estimates of 16.9%. After excluding one-time factors such as warranty reserve reversals ($230 million) and tariff-related FX gains ($200 million), the core vehicle gross margin (excluding credits) stood at ~17.5%.
Despite dual pressures of rising per-unit depreciation costs (up $500 sequentially due to lower production volumes) and higher raw material prices (up $1,000 sequentially), the core margin dipped only slightly by 0.4 percentage points from 17.9% in the prior quarter. Benefiting from the ASP rebound, the 17.5% margin significantly outperformed market expectations of 14.7%-15.3%.
④ Heavy R&D and capex investments continue to fund AI ambitions: Tesla's R&D expenses reached $1.95 billion, rising sequentially, with major allocations to FSD training iterations, AI5 chip design, and new product lines like Cybercab and Optimus.
Despite sequential increases in selling and R&D expenses, stronger-than-expected revenue and gross margins, coupled with no surge in capex this quarter, drove free cash flow to $1.4 billion (net inflow), far exceeding consensus estimates of a net outflow.
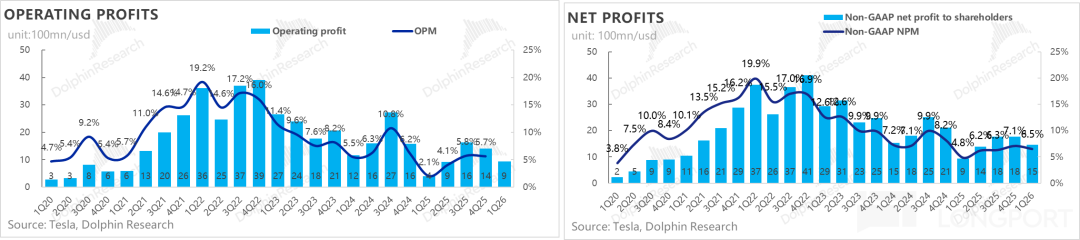
⑤ Operating profit exceeded expectations: Despite higher R&D expenses due to AI investments and increased SBC expenses (mainly CEO performance awards) driving selling, general, and administrative (SG&A) expenses up to $1.83 billion, operating profit reached $940 million, significantly above consensus estimates of $360 million. The operating margin hit 8.2%, up 1.6 percentage points sequentially despite headwinds.
Dolphin Research's Overall View:
Tesla delivered a Q1 2026 report that appeared strong on the surface and demonstrated underlying resilience. While the comprehensive beat in core revenue, gross margin, and net profit was partly flattered by one-time financial factors, stripping these out reveals that its automotive business still outperformed amid widespread pessimism.
Specifically, the sequential rebound in ASPs and stabilization of core vehicle gross margins dispelled market fears that weak deliveries would collapse profitability.
More notably, despite aggressive spending on AI frontiers (self-designed chips, Optimus, FSD) and elevated SBC expenses driving up overall R&D and selling costs, Tesla still generated $1.4 billion in positive free cash flow, far exceeding pessimistic market expectations. This underscores the automotive business's continued role as a stable "ballast" for the company.
However, the automotive business's weighting in Tesla's valuation narrative is diminishing, with its role now reduced to a "cash cow." The market's real anxieties lie in: Whether the timeline for AI monetization will be repeatedly pushed back? Can the financial model remain sustainable under heavy capex?
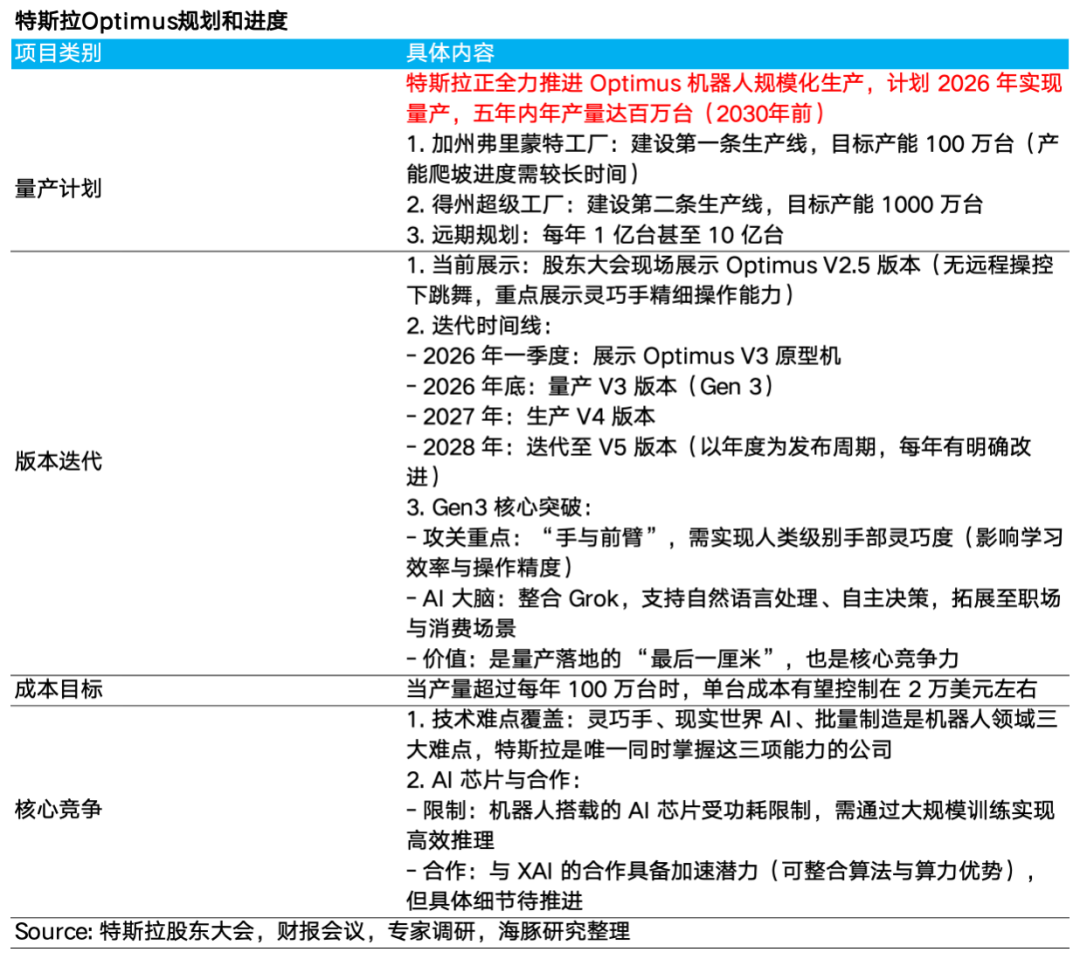
① Optimus: V3 launch delayed to mid-year, mass production to begin in 2027
a. V3 launch postponed with strict confidentiality: Musk stated that the V3's system design is nearly complete, with aesthetic refinements underway. A reveal is planned for mid-year (Middle of this year). The delay aims to prevent competitors from frame-by-frame analysis and technology theft, favoring a public unveiling closer to mass production.
b. Initial production timeline and ramp-up: Fremont factory is preparing for production, with management targeting late July or August for start-up.
As a brand-new product with over 10,000 unique components and a new supply chain, initial production will be slow. Significant capacity increases are expected only next year.
c. Deep production line reconfiguration: To free up capacity for Optimus, Tesla is dismantling the Model S/X production line (final production scheduled for early May). Replacing it with a new Optimus test line will take ~4 months, seen as a challenging but remarkably fast engineering feat.
d. A second Optimus factory is under construction at Giga Texas, slated to start production next summer. Initially, Optimus will perform simple tasks in factories before expanding to external use cases sometime next year. The newly tape-out AI5 chip will also be deployed in Optimus.
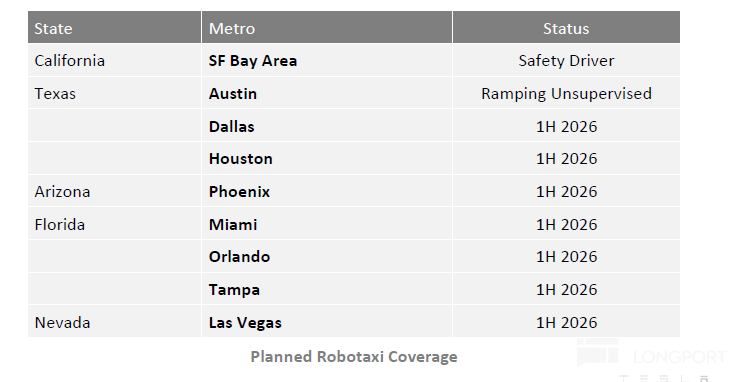
② Robotaxi: Safety-first approach limits expansion, material financial contributions delayed to 2027
a. Steady regional expansion: Robotaxi has expanded to Dallas and Houston, targeting unsupervised operations in over a dozen states by year-end.
b. Prolonged validation cycles: Stricter safety baselines require expanding QA fleets for accelerated testing. Musk explicitly guided that Robotaxi and unsupervised FSD will not materially contribute to financials in 2026, with the inflection point pegged to 2027.
c. Architectural bottlenecks: Current test fleets still run on the v14.3 variant. Management deems large-scale Robotaxi deployment unreasonable until the v15 rewrite, which significantly raises safety ceilings, is released.
③ FSD: Unsupervised capabilities to roll out to customer fleets starting Q4 2026
a. Unsupervised FSD rollout plan: Expected to begin gradually deploying unsupervised functionality to customer fleets in Q4 2026. Rollouts will proceed geographically, contingent on confirming absolute safety in specific regions (without complex intersections or severe road/weather conditions).
b. Musk confirmed that Hardware 3 (HW3) has only one-eighth the memory bandwidth of HW4 and cannot support unsupervised FSD. Tesla will offer trade-in discounts or upgrade services (replacing compute platforms and cameras) for HW3 owners who purchased FSD.
To streamline upgrades, Tesla plans to establish "micro-factories" in major cities. Meanwhile, HW3 owners will receive a stripped-down digital version based on v14 by late June.
c. Evolution of the v15 architecture: Current v14.3 is seen as the final piece of the existing architecture. The v15 rewrite, expected by year-end or early next year, will overhaul the software stack to run entirely on AI, aiming to elevate safety well beyond human levels.
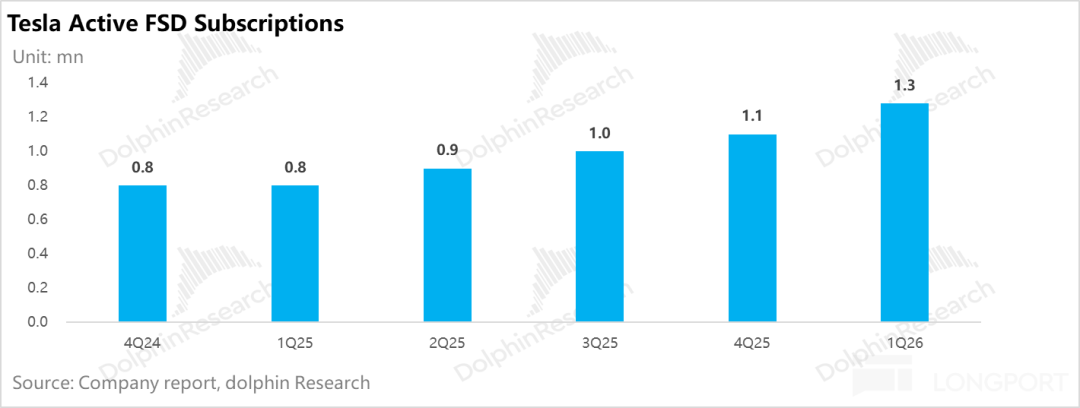
d. FSD subscriptions: Global paid FSD customers neared 1.3 million. Since February 15, 2026, Tesla eliminated one-time FSD purchases globally, fully transitioning to a monthly subscription model (priced at $99/month), driving subscription growth as the primary driver.
New FSD users as a share of new vehicle sales rose from 24% last quarter to 50% this quarter, with paid FSD users accounting for ~14% of Tesla's global installed base. As high-margin software revenue, it also contributed to the sequential rebound in average vehicle prices and the outperformance of core automotive gross margins.
e. Overseas expansion: In Europe, regulatory approval has been secured in the Netherlands, with EU review submissions to Brussels expected in May and broader approval likely in Q2. China has also received partial approvals, with regulatory collaboration ongoing to secure broader licenses by Q3. Amid these developments, Tesla's sales strategy has evolved to emphasize FSD as the core product, with vehicles serving merely as delivery vehicles.
Overall, while Tesla's automotive business performed decently this quarter, and expectations for main business demand have revived amid rising oil prices and stimulus for entry-level Model 3/Y variants, helping stabilize the company's fundamentals, the AI segment—its most valuation-sensitive area—faces extended timelines: Optimus V3's delayed launch, Robotaxi's commercialization pushed to 2027, and the need to await FSD v15 to overcome technical hurdles have lengthened the market's expected timeline for realization.
A more severe test lies in funding: Tesla raised its 2026 capex guidance from "over $20 billion" to "over $25 billion," fully ramping up construction of six new factories (including lithium refining, Cybercab, and Optimus plants) and AI compute clusters (Cortex training clusters, Terrafab).
While holding over $44 billion in cash and investments on the balance sheet, annual "burn rates" of $25 billion will heighten reliance on automotive operating cash flow—AI ambitions must urgently achieve commercial closure and self-sufficiency, or the company could face realistic financing pressures within one to two years.
Dolphin Research believes the delay in AI progress, compounded by heavy capex pressures, may cause short-term volatility in Tesla's stock price. However, from a long-term perspective, Tesla's AI narrative is genuinely transitioning from "conceptual PPTs" to the "eve of profit realization," with immense long-term potential.
Below is a detailed analysis of the earnings content
1. Tesla: A Report That Appears Strong and Demonstrates Underlying Resilience
1.1 Automotive Business Rarely "Exceeds Expectations," with Vehicle ASPs Finally Rebounding Sequentially
Total revenue for the quarter reached $22.4 billion, up 16% YoY, significantly exceeding consensus estimates of $20.7-20.9 billion. While this included ~$900 million in positive FX impact, adjusted revenue of $21.5 billion still topped expectations.
The primary drivers of the upside were: ① A sequential rebound in automotive ASPs after multiple quarters of declines; ② Growth in services and other business revenue.
Details:
① Automotive Business: Core Vehicle Sales Revenue as the Largest Source of Upside
Total automotive revenue reached $16.2 billion, up 16% YoY, exceeding market expectations of $15.3 billion, including:
Regulatory credit revenue of $380 million in gross profit, down $160 million sequentially, within expectations due to prior carbon emission regulation adjustments.
However, core automotive sales revenue (excluding credits and leasing) hit $15.5 billion, exceeding the $14.5 billion forecast and serving as the primary driver of the upside. This was mainly due to a sequential rebound in ASPs of $2,500 to $43,600, ending a prolonged decline.
Even under extreme assumptions—attributing all $900 million in FX gains to automotive sales—adjusted per-unit revenue would remain flat sequentially (~$41,100). In reality, FX gains are allocated across businesses, so the true per-unit revenue rebound would be higher after excluding FX impacts.
Dolphin Research attributes the ASP rebound to: a) An improved product mix with a higher share of premium models (Model S/X and Cybertruck); b) Reduced promotional discounts; c) Increased deferred revenue recognition from FSD subscriptions (with record-high new subscriptions this quarter).
② Energy Business: Short-Term Pressured by Demand Front-Loading and Recognition Cycles, but Medium-to-Long-Term Certainty Remains High
Energy business revenue reached $2.41 billion (-12% YoY), with energy storage shipments declining to 8.8 GWh (-15% YoY, -38% QoQ). The Periodic pressure (temporary pressure) stemmed from:
a. Demand front-loading: To avoid higher 2026 tariffs and meet IRA local supply chain subsidy thresholds, significant energy storage projects were front-loaded in prior periods, causing short-term demand depletion this quarter.
b. Fluctuations in project-based revenue recognition: Energy storage projects (especially large-scale Megapacks) involve lengthy sales, production, transportation, and installation cycles, which can easily lead to quarterly fluctuations in revenue recognition.
v. Disruptions from low-price competition: The U.S. domestic market faces low-price competition from Chinese manufacturers with cost advantages. However, as the IRA Act's localization requirements increase year by year, Tesla's moat as a domestic giant is further strengthening.
With the explosion in demand for green power from AI data centers (AIDC) to handle highly volatile AI workloads, along with the rigid peak-shaving demand driven by new energy installations (photovoltaic + wind power) on the U.S. energy side, the energy storage sector exhibits extremely high certainty. Tesla is currently ramping up its 'ground-mounted photovoltaic + energy storage' and space-based solar power combination solutions, precisely positioning itself to supply power to both the grid and AI computing.
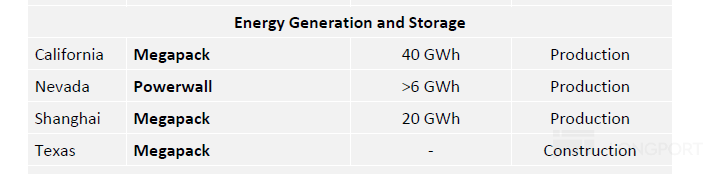
Meanwhile, on the production side, preparations are underway. The Houston factory will produce the next-generation Megapack 3 and Megablock products, pushing toward a total annual capacity target of 66 GWh/year (existing 60 GWh, including 40 GWh in California, 20 GWh in Shanghai, and 6 GWh of Powerwalls), sufficient to support the surge in shipments driven by high demand growth.
③ Service business performs well
Revenue in this quarter reached $3.75 billion, up 42% year-over-year, surpassing market expectations of $3.18 billion. In addition to the aforementioned exchange gain reasons, the improvement may primarily be attributed to:
a. Tesla's continuous investment in and expansion of its Supercharger network. As of Q1-2026, the number of global Supercharger stations reached 8,463, a 19% year-over-year increase.
b. Natural growth in after-sales parts sales and service center operations due to the continuous expansion of the global vehicle fleet, bringing stable revenue.
c. Expansion of the company's robotaxi fleet size, which also generates more revenue.
c. The company continues to roll out its insurance products in more states (such as Florida). In some states, using FSD (Supervised) can help customers obtain premium discounts or even fully offset the monthly subscription cost of FSD, enhancing the synergistic effect between FSD and insurance products and potentially driving growth in service revenue.
1.2 Automotive gross margin: Core profitability exceeds expectations, but one-time factors need to be stripped out
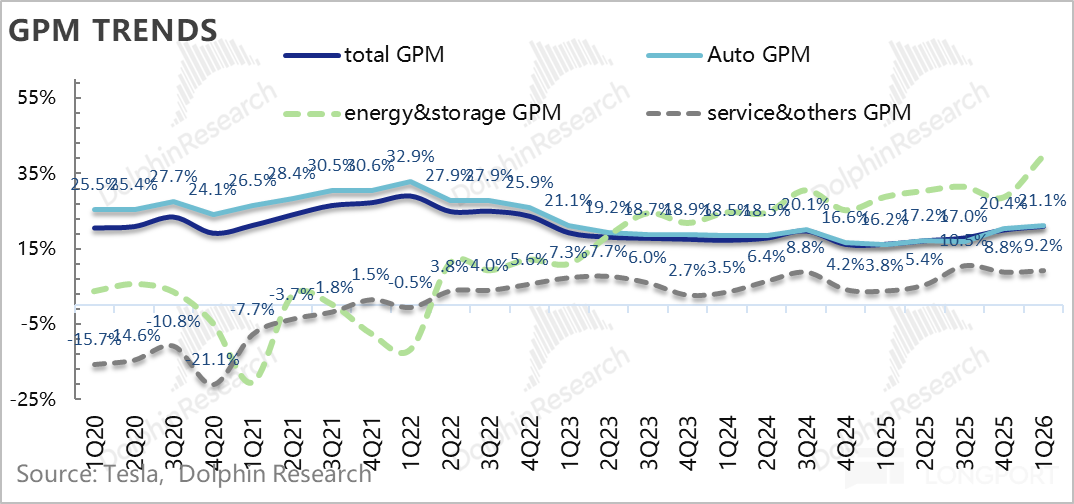
The gross margin in Q4 was 21.1%, significantly higher than market expectations of 16.9%, primarily due to much stronger-than-expected gross margins from vehicle sales and energy storage business. However, after removing one-time impacts, the actual gross margin for the quarter was 18.7%, down 1.4 percentage points from the previous quarter's high of 20.1%, but still higher than market expectations.
In quarterly financial reports, the performance of automotive gross margin often provides more insightful information than revenue itself. In this quarter, Tesla's overall automotive gross margin reached 21.1%, up a further 0.7 percentage points from the previous quarter's high of 20.4%. Notably, this improvement was achieved despite a decline in the contribution from regulatory credit revenue, which is purely profit-based.
However, this quarter's profits included two significant one-time positive impacts: a. Warranty reserve reversal: Approximately $230 million in warranty reserves were reversed; b. Exchange gains: Approximately $200 million in tariff-related exchange gains (fully recognized in the automotive business under extreme assumptions).
After excluding the aforementioned one-time factors, the actual core automotive gross margin for the quarter was approximately 17.5%. Although this level was slightly down from the previous quarter's 17.9%, it was still significantly higher than market expectations. Dolphin Research believes this was primarily driven by the sequential rebound in average selling prices (ASPs) of vehicles sold and increased recognition of high-margin FSD revenue, offsetting the adverse impacts of rising per-unit amortized costs due to declining sales volumes and upward pressure from upstream raw material costs.
Among other businesses, the energy storage business gross margin reached 40%, up sharply by 11 percentage points sequentially, far exceeding market expectations of 28%. However, this included a tariff subsidy benefit of approximately $250 million. After excluding this one-time impact, the energy storage business gross margin was approximately 29.2%, roughly in line with the previous quarter.
Despite continued strong demand for energy storage, the business is expected to face margin pressure in the future due to persistent negative tariff impacts, as most battery cells are still procured from China, and increasing industry competition.
Services and other businesses: The gross margin for the quarter was 9.2%, up 0.4 percentage points sequentially. Growth was primarily driven by improved utilization and margins of the Supercharger network, as well as the early expansion of the Robotaxi business.
II. Actual vehicle sales business exceeds low market expectations
As the most critical indicator each quarter, automotive gross margin is of utmost importance, especially given the aging of Tesla's current vehicle lineup and intensifying competition. To gain a clear understanding of the true state of automotive gross margins, Dolphin Research has broken down the gross margins for automotive sales (excluding regulatory credits), automotive leasing, and the overall automotive business.
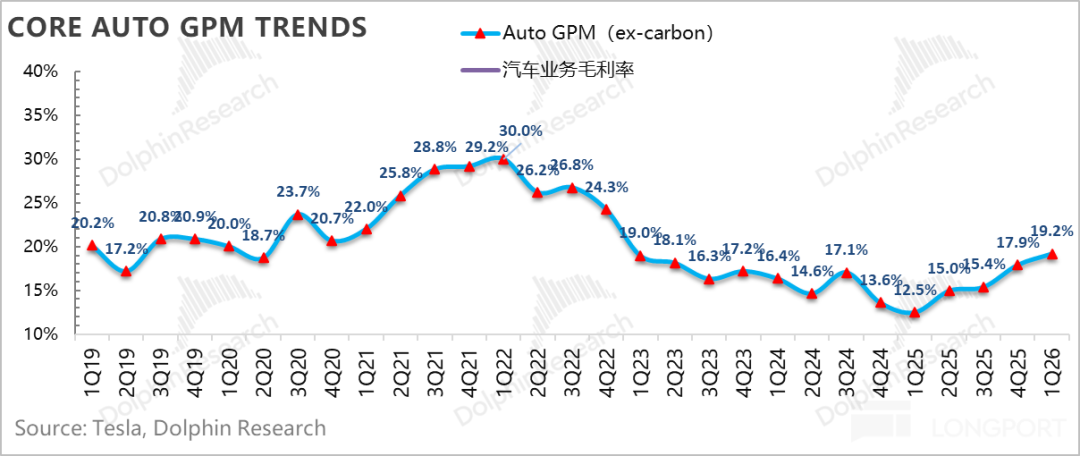
In Q1, the automotive sales gross margin (excluding regulatory credits and leasing) was 19.2%, significantly exceeding market expectations of 15.3% and up 1.3 percentage points sequentially. However, as mentioned earlier, this quarter was impacted by two one-time factors ($230 million in warranty reserve reversal and $200 million in tariff-related exchange gains). After adjusting for these, the actual core automotive gross margin was approximately 17.5%, still higher than market expectations of 14.7%-15.3%, with the rebound in per-unit ASP being the primary driver.
From a per-unit economic perspective:
2.1 Vehicle selling prices finally stop declining and rebound
From the perspective of per-unit selling prices, in Q1, Tesla's revenue per vehicle sold (excluding regulatory credits and automotive leasing sales) was $43,600, up sharply by $2,500 sequentially and higher than market expectations of $41,000.
However, $900 million in exchange gains were recognized in revenue this quarter. Even under extreme assumptions, if the entire $900 million in exchange gains were attributed to automotive sales, the adjusted per-unit revenue would still be flat sequentially (approximately $41,100, actually higher), primarily due to product mix optimization, the withdrawal of U.S. promotional discounts, and the positive contribution from FSD revenue.
Specifically:
① Subsidy intensity declines in the U.S. in Q1, while increasing in China
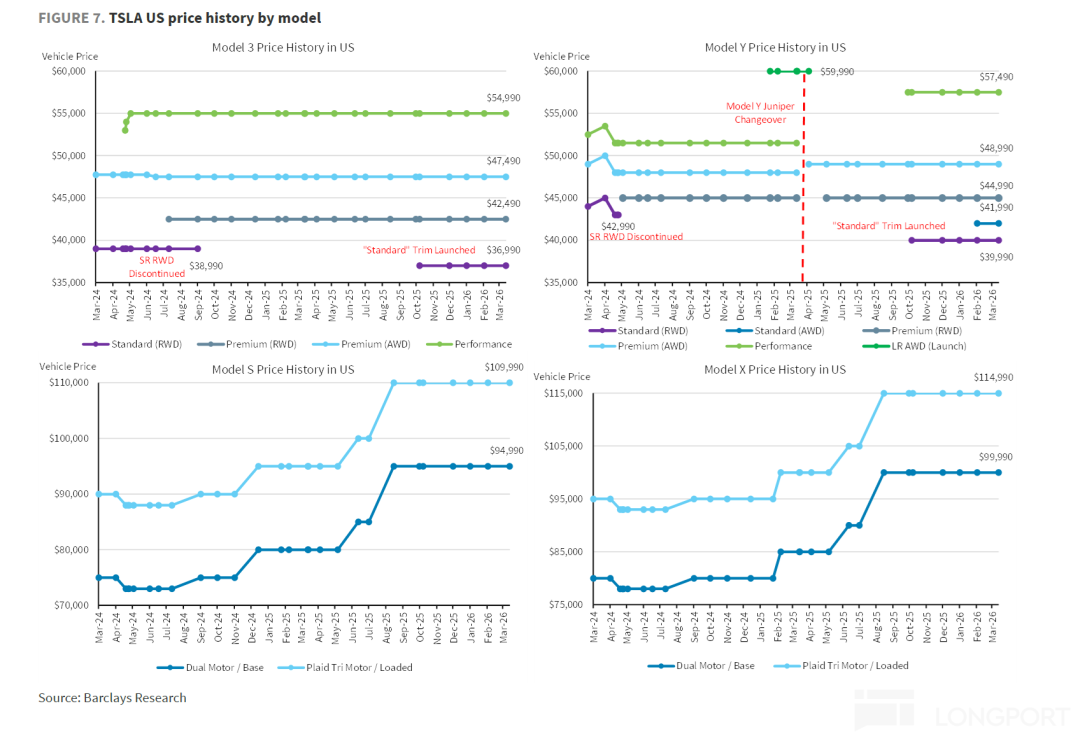
a. U.S.: Pricing remains unchanged, but subsidy intensity declines
Although the official suggested price (official list price) for the Model 3/Y remained stable (a more price-competitive base version was pre-launched in Q4 2025 to hedge against subsidy reductions), the company significantly rolled back promotional efforts from Q4 2025. For example, the highly attractive '0 down payment leasing program' in Q4 2025 was officially discontinued in Q1 2026, and leasing rates increased sharply sequentially.
Despite the rise in effective purchase costs, Tesla's market share was not severely impacted during the rollback of promotions, thanks to a less competitive overall U.S. EV market environment—traditional automakers generally reduced discounts in Q1 2026 after aggressive inventory clearance in Q4 2025.
However, directly affected by the IRA subsidy reductions, overall market demand for new energy vehicles in the U.S. in Q1 faced pressure, and industry growth slowed. Dragged down by this broader environment, Tesla's absolute delivery volumes in the U.S. saw a year-over-year and sequential decline to a certain extent.
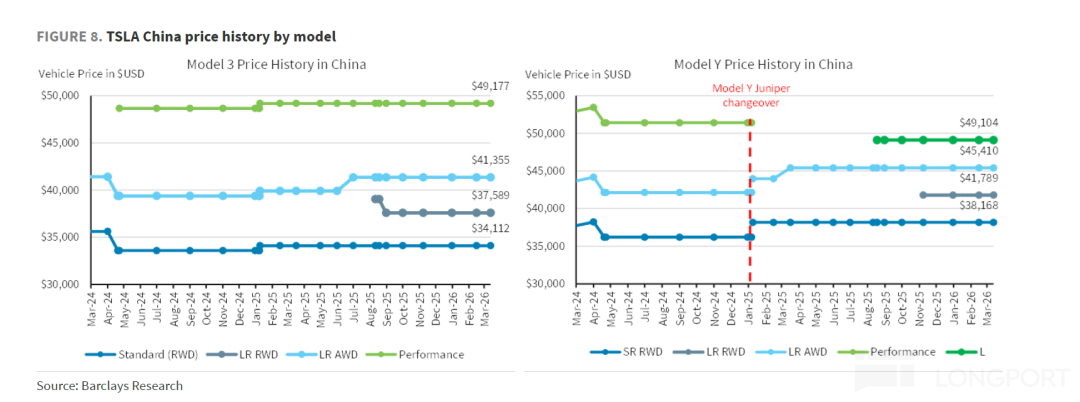
b. China: Subsidy intensity increases sequentially, offsetting the impact of new energy vehicle purchase tax reductions
The sequential increase in subsidy intensity in China was largely to offset the impact of rising vehicle costs after the phase-out of new energy vehicle purchase subsidies. Tesla introduced a new 7-year ultra-low-interest loan program for the Model 3/Y for nearly the entire Q1, continued the 5-year zero-interest financing scheme launched in Q4 2025, and offered other subsidies such as paint discounts and inventory vehicle discounts.
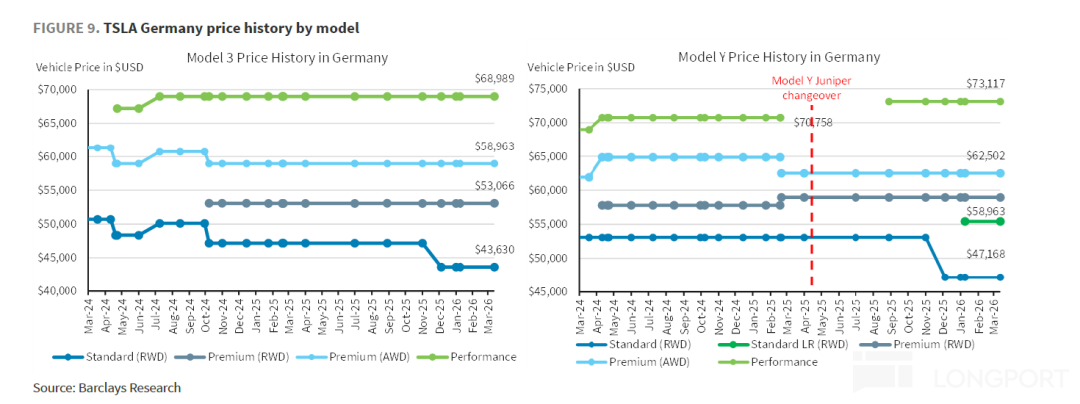
c. Europe: Promotional offers continue
In Q1, Tesla maintained the price reductions for the standard versions of the Model 3/Y in the European market that were implemented in Q4 2025, and offered 0% interest loans for up to 5 years in some markets. In the current high-interest-rate environment in Europe, the interest-free policy effectively reduced purchase costs for consumers.
② Vehicle mix: Higher-priced Model S/X + Cybertruck account for a larger share
From a vehicle mix perspective, the share of Tesla's higher-priced Model S/X + Cybertruck in this quarter increased by 2 percentage points sequentially to 5% from 3% in the previous quarter. Additionally, the company continued to introduce relatively more expensive long-range rear-wheel-drive versions as entry-level models in global markets, improving the vehicle mix.
③ FSD business: New paid users reach a record high this quarter
In Q1, the number of global paid FSD users reached nearly 1.28 million (a net increase of 180,000 sequentially), up 49% year-over-year, setting a new record for net new users in a single quarter.
Starting from February 15, 2026, Tesla globally eliminated the one-time purchase option for FSD and fully transitioned to a monthly subscription model (currently priced at $99/month). This move drove subscription users to become the absolute main driver of growth.
The proportion of new FSD users to new vehicle sales increased from 24% in the previous quarter to 50% in this quarter, with FSD paid users accounting for approximately 14% of Tesla's global installed vehicle fleet. As high-margin software revenue, it also contributed to the sequential rebound in average selling prices of vehicles and the better-than-expected performance of core automotive gross margins.
2.3 Per-unit costs continue to rise
After discussing per-unit prices, let's now examine per-unit costs. Generally, Tesla achieves cost reductions through four dimensions: 1) Scale dilution from increased sales volumes and full utilization of production capacity; 2) Technological cost reductions; 3) Natural cost reductions in battery raw materials; 4) Government subsidies. Specifically:
Dolphin Research breaks down per-unit costs into per-unit depreciation and per-unit variable costs. The per-unit economics in Q1 were as follows:
1) Per-unit depreciation effect: Scale effect release is hindered, and per-unit amortized costs continue to rise sequentially
The per-unit depreciation amount in this quarter was $0.44, up $500 sequentially in absolute terms. The per-unit amortized cost rate also rose by 0.6 percentage points sequentially to 10.2% this quarter from 9.6% in the previous quarter, primarily due to the sequential decline in production and sales volumes this quarter (vehicle sales volumes declined 14.4% sequentially to 358,000 units in Q1), hindering the release of scale effects.
2) Per-unit variable costs: Variable costs are also rising
The company's per-unit variable costs were $36,000 in this quarter, up $1,000 sequentially, primarily due to comprehensive price increases in core automotive metals (steel, aluminum, copper) and storage costs, creating cost pressures.
However, starting from November 2025, the U.S. expanded the manufacturer's suggested retail price (MSRP) reduction allowance by 3.75% for domestically produced vehicle models, enabling Tesla to receive tariff rebates from the government, which is expected to continue benefiting in Q1 and partially offset the impact of rising raw material costs.
3) Automotive gross margin exceeds expectations
Ultimately, despite the hindered release of scale effects and rising per-unit costs due to raw material price increases, benefiting from the sequential increase in per-unit selling prices of vehicles sold, the automotive sales gross margin in Q1, after excluding one-time factors and regulatory credits, was 17.5%, still higher than market expectations of 14.7%-15.3%.
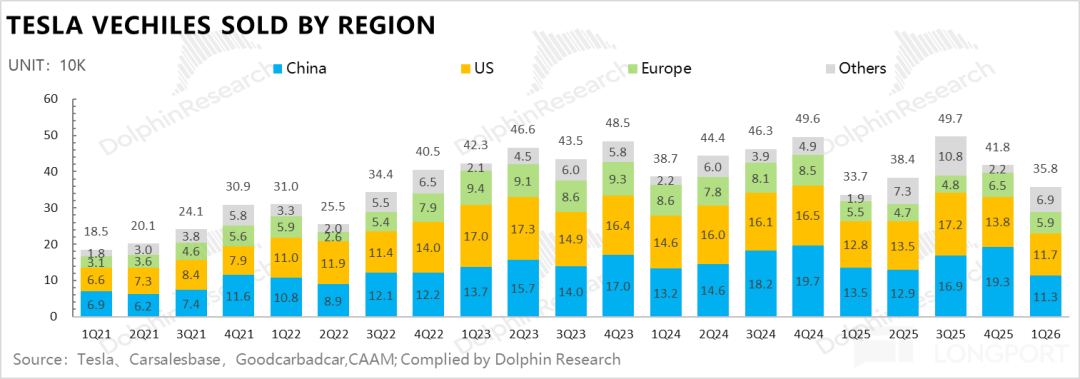
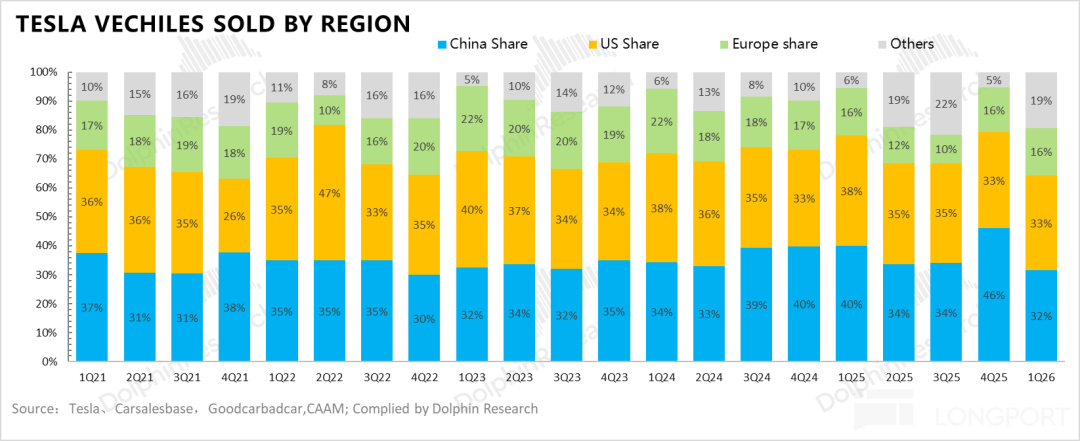
III. Q1 delivery volumes underperform due to policy headwinds in Chinese and U.S. markets
Tesla delivered 358,000 vehicles in Q1, below market expectations of 370,000 units, primarily due to the phase-out of new energy vehicle purchase tax incentives in the Chinese market and the $7,500 IRA subsidy reduction in the U.S. market, which put pressure on Tesla's sales volumes in these two markets.
However, the European market, stimulated by policy subsidies (multiple European countries, such as Italy, Spain, and France, reinstated or introduced new EV subsidies starting in Q4 2025), directly boosted consumer demand. Coupled with Tesla's continuation of promotional offers in Europe, this to some extent offset the pressure on Tesla's sales in the Chinese and U.S. markets.
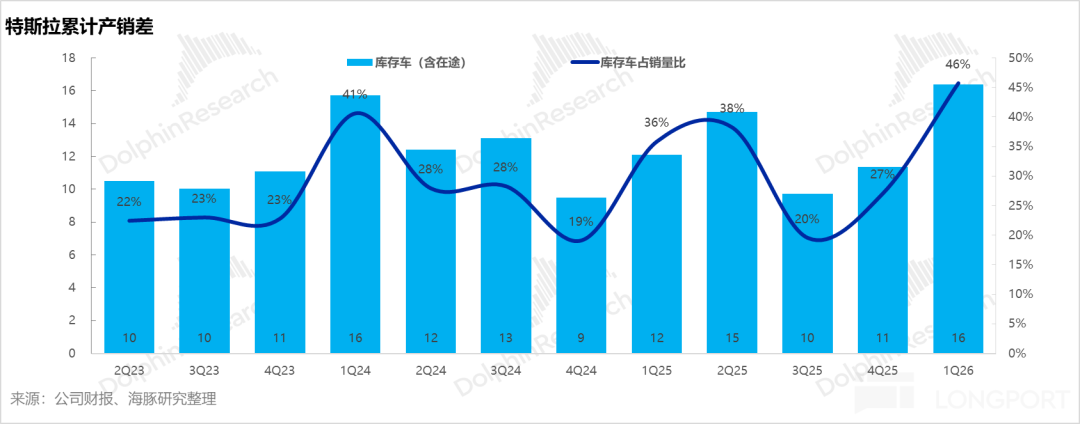
From the perspective of production and sales gap, Tesla produced 408,000 vehicles in the first quarter, 50,000 more than its deliveries, continuing to result in inventory backlogs. Tesla's inventory turnover days increased from 15 days in the previous quarter to 27 days this quarter. However, despite the significant increase in inventory eroding cash flow, due to factors such as increased deferred revenue and decreased accounts receivable, the operating cash flow for this quarter actually rose by RMB 120 million quarter-over-quarter to RMB 3.9 billion.
IV. Expenditure Side: Continued Increased Investment in AI Business
Tesla's R&D expenses and sales costs continued to rise this quarter, with R&D expenses reaching RMB 1.95 billion, up by USD 160 million quarter-over-quarter, primarily due to continued increased investment in AI intelligence and new product R&D. The R&D expenses were mainly invested in the training and iteration of FSD, the design of the AI5 chip, and the R&D of new product lines such as Cybercab and Optimus.
Sales and administrative expenses reached RMB 1.83 billion this quarter, up by USD 180 million quarter-over-quarter, and also higher than the market estimate of RMB 1.51 billion, mainly due to an increase in SBC expenses of approximately USD 120 million this quarter (primarily due to increased CEO performance incentives), leading to an increase in sales and administrative expenses.
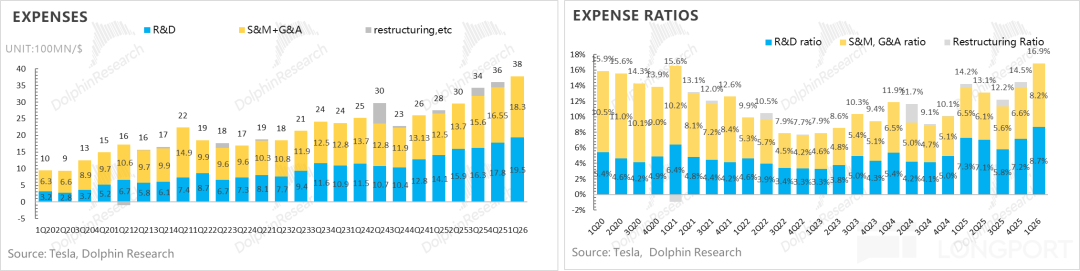
Finally, despite the increased investment in the three expense categories, both revenue and gross profit margin exceeded expectations. Operating profit reached RMB 940 million, significantly higher than the market expectation of RMB 360 million, with an operating profit margin of 8.2%, up by 1.6 percentage points quarter-over-quarter.
In terms of net profit, due to losses caused by Bitcoin fluctuations this quarter, net profit was only RMB 490 million, with the net profit margin declining by 1.3 percentage points quarter-over-quarter to 2.1%.
In terms of free cash flow, despite continued significant investment in AI-related fields (self-developed AI chips, Optimus, FSD R&D) and a quarter-over-quarter increase in SBC expenses, leading to increases in both sales and R&D expenses, driven by both revenue and gross profit margin exceeding expectations, coupled with no surge in capital expenditures this quarter, Tesla's free cash flow for the first quarter was USD 1.4 billion, achieving a net inflow, far better than the market expectation of a net outflow.
The company has significantly raised its capital expenditure guidance for 2026 from the previous "exceeding USD 20 billion" to "exceeding USD 25 billion," primarily to support the construction of six new factories (including lithium refineries, Cybercab, Optimus, etc.) and AI computing infrastructure.
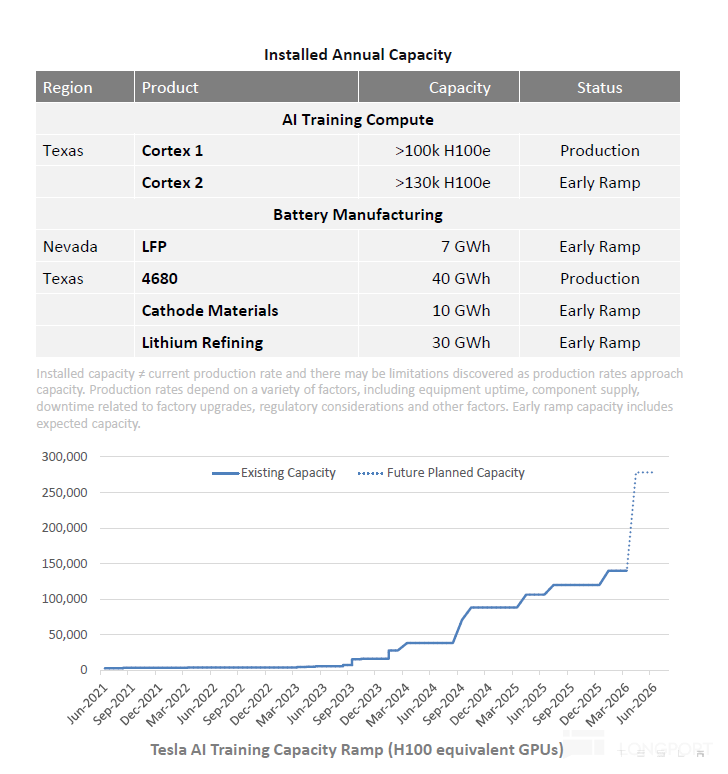
In terms of AI computing power construction, the Cortex 2 training cluster is now online and has started running workloads. According to the company's plans, to support the training of Optimus and autonomous driving models, computing power investment will continue to increase significantly. According to Tesla's plans, the cortex training cluster is expected to reach a computing power level exceeding 250,000 equivalent H100s in the second quarter, doubling from nearly 150,000 in the first quarter.
Although the company still has ample cash and investments on hand (exceeding USD 44 billion), at the current capital expenditure intensity of over USD 25 billion per year, the existing cash can only support high-intensity investment for less than two years. The grand long-term blueprint for AI urgently needs to be translated into substantial revenue and cash flow as soon as possible; otherwise, the company will face potential financing pressures.
- END -
// Reprint Authorization
This article is an original piece from Dolphin Research. Reprinting is only allowed with authorization.
// Disclaimer and General Disclosure Notice
This report is intended solely for general comprehensive data purposes, designed for general reading and data reference by users of Dolphin Research and its affiliated institutions. It does not take into account the specific investment objectives, investment product preferences, risk tolerance, financial situation, or special needs of any individual receiving this report. Investors must consult with independent professional advisors before making investment decisions based on this report. Any person making investment decisions based on the content or information mentioned in this report assumes their own risk. Dolphin Research shall not be liable for any direct or indirect responsibilities or losses that may arise from the use of the data contained in this report. The information and data contained in this report are based on publicly available materials and are intended for reference purposes only. Dolphin Research strives to ensure, but does not guarantee, the reliability, accuracy, and completeness of the relevant information and data.
The information mentioned or views expressed in this report shall not, under any jurisdiction, be regarded or construed as an offer to sell securities or an invitation to buy or sell securities, nor shall it constitute advice, solicitation, or recommendation regarding relevant securities or related financial instruments. The information, tools, and materials contained in this report are not intended for or proposed for distribution to jurisdictions where the distribution, publication, provision, or use of such information, tools, and materials would conflict with applicable laws or regulations, or would result in Dolphin Research and/or its subsidiaries or affiliated companies being subject to any registration or licensing requirements in such jurisdictions, nor to citizens or residents of such jurisdictions.
This report merely reflects the personal views, insights, and analytical methods of the relevant creators and does not represent the stance of Dolphin Research and/or its affiliated institutions.
This report is produced by Dolphin Research, and the copyright is solely owned by Dolphin Research. Without the prior written consent of Dolphin Research, no institution or individual shall (i) make, copy, reproduce, duplicate, forward, or create any form of copies or replicas in any manner, and/or (ii) directly or indirectly redistribute or transfer to other unauthorized persons. Dolphin Research reserves all relevant rights.
-
How Meituan is Becoming the 'Interface' for AI Integration into the Physical World
-
![]()
RoboScience Machine Science Makes ICRA Best Paper List for Two Years Running with Its 'Embodied Brain' Innovation
-
![]()
Focusing on UTG Ultra-Thin Flexible Glass! CSG Optical New Material Production Base Establishes in Xianning, Hubei
-
![]()
AI Meets Optics: Tsinghua Smart Vision Secures A+ Round Funding Led by Hillhouse Capital
-
![]()
Why are 3C Brands Flocking to Douyin Mall During 618?
-
![]()
Token Economy Falters as Economic Tokenization Faces Challenges
-
![]()
Lenovo's Monthly Surge of 109%, Foxconn Industrial Internet's Market Cap Surpasses Kweichow Moutai: A Collective Resurgence of the 'IT Old Guard'?
-
![]()
After Zhang Xue's Victory, Where is Motorcycle Intelligence Headed?