Tesla: Building Cars Against the Odds, but AI Promises Remain Unfulfilled?
 07/27 2026
 349
349
Tesla released its Q2 2026 financial report after the U.S. stock market closed on the morning of July 22 (Beijing Time), with overall results falling short of expectations. Here’s a detailed breakdown:
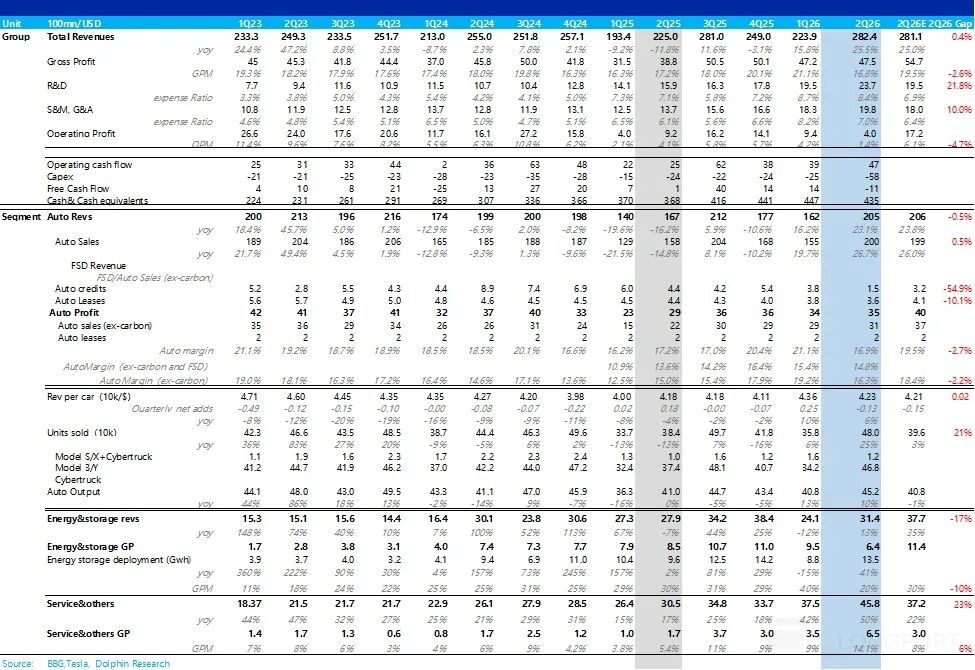
① Total revenue performed well: Tesla’s Q2 total revenue reached $28.2 billion, up 25.5% year-over-year, roughly in line with the expected $28.1 billion. However, this included a positive foreign exchange impact of $500 million. Excluding this one-time factor, adjusted revenue was $27.7 billion, slightly below expectations.
In its core business, automotive revenue was $20 billion, largely meeting expectations, but the average selling price (ASP) continued to decline quarter-over-quarter. Energy storage revenue was $3.14 billion, significantly below the expected $3.77 billion, primarily due to a drop in storage unit prices—reflecting intensified competition in the sector.
② Automotive revenue barely met expectations: Core automotive sales revenue (excluding regulatory credits and leasing income) was $20 billion, roughly in line with market expectations. The 27% year-over-year increase was mainly driven by higher vehicle sales volume.
However, the ASP continued to decline, reaching $42,000 per vehicle this quarter, down $1,300 quarter-over-quarter. This was primarily due to a shift in product mix toward lower-priced models (Model S/X discontinuation), ongoing promotional discounts offsetting minor price hikes (especially due to rising interest rates increasing financing costs), and negative regional mix effects (declining U.S. share, rising European and other international shares).
③ Automotive gross margin fell sharply below expectations: The actual automotive gross margin (excluding regulatory credits and leasing income) was just 16.3% this quarter. Despite vehicle sales volume exceeding expectations, the margin declined by 2.9 percentage points quarter-over-quarter and also fell short of the expected 18.4%.
Last quarter, Tesla benefited from $250 million in one-time warranty and tariff relief, contributing about 2 percentage points to the gross margin. This benefit no longer existed this quarter. Additionally, rising commodity prices and increased financing costs due to higher interest rates put pressure on the automotive gross margin.
④ Heavy R&D and capital expenditures continue to fund AI ambitions: Tesla’s R&D expenses reached $2.37 billion this quarter, continuing to rise sharply, primarily invested in FSD training iterations, AI5 chip design, and new product lines like Cybercab and Optimus. Management expects R&D investment to increase further.
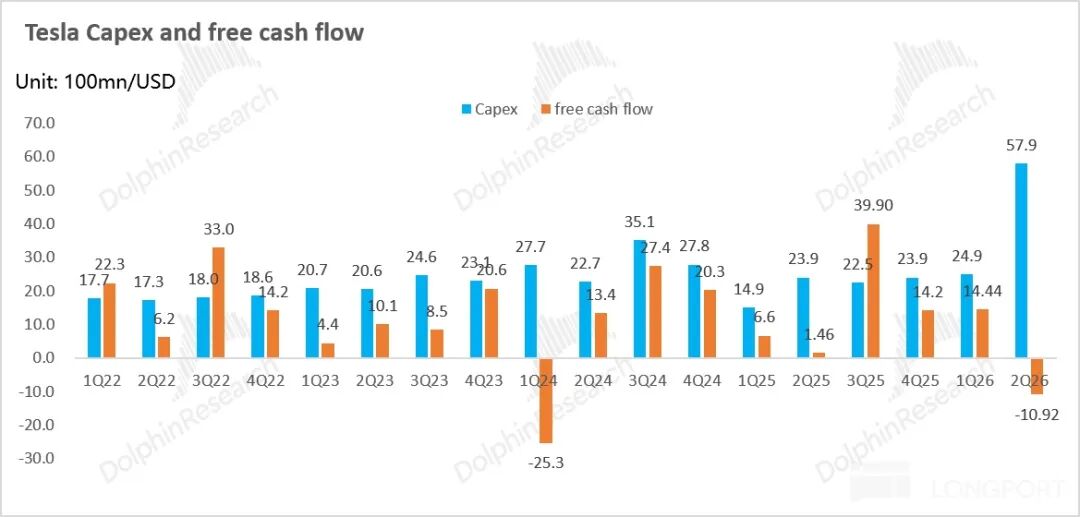
Capital expenditures rose by $3.3 billion quarter-over-quarter to $5.8 billion, directly causing free cash flow to turn negative again at -$1.1 billion, a $2.5 billion decline quarter-over-quarter.
⑤ Operating profit fell sharply below expectations, with margins declining: Finally, due to the gross margin falling significantly below expectations, rising R&D expenses from AI investments, and increased selling, general, and administrative (SG&A) expenses from SBC charges (mainly CEO performance awards), operating profit was just $400 million, well below the market expectation of $1.72 billion. The operating profit margin was only 1.4%, down 2.8 percentage points quarter-over-quarter.
Dolphin Research's View
Overall, after vehicle deliveries exceeded expectations this quarter and market expectations for the financial report were raised accordingly, Tesla released results that fell short on the profit side.
The ASP of the core automotive business continued to decline slightly quarter-over-quarter, while the actual automotive gross margin, even with cost reductions per unit due to economies of scale and thickening (enhanced) high-margin FSD subscription revenue, still declined by nearly 3 percentage points quarter-over-quarter to 16.3% this quarter.
In addition to the absence of last quarter’s one-time benefits (about $250 million in warranty and tariff relief, contributing about 2 percentage points), the continuous decline in ASPs and rising raw material costs (lithium, steel, aluminum, copper, DRAM) collectively dragged down the gross margin.
Tesla’s energy storage business, its second growth driver, also underperformed. The energy storage gross margin plummeted by 20 percentage points quarter-over-quarter to just 20%, primarily due to the absence of 1Q26’s one-time tariff benefits (about $250 million) and declining storage unit prices.
However, management expects energy storage gross margins to trend downward due to intensifying competition and tariff impacts, potentially stabilizing in the low-to-mid-20% range long-term. This is significantly lower than the previous steady-state level of 30%+, reflecting substantial competition even for Tesla, whose energy storage business is primarily based in the U.S. market.
Thus, despite Delivery Volume (deliveries) exceeding expectations this quarter, overall profitability fell short of expectations, with core operating profit continuing to decline quarter-over-quarter. With sustained high Capex investments, Tesla’s free cash flow turned negative (declining by $2.5 billion quarter-over-quarter to -$1.1 billion).
Nevertheless, Tesla maintained its full-year Capex guidance of over $25 billion (primarily for expanding the Robotaxi fleet, increasing Optimus production capacity, building a semiconductor factory, boosting solar manufacturing capacity, and AI computing infrastructure). This implies about $16.7 billion in Capex for the second half of the year (compared to ~$8.3 billion in the first half).
With profit margins under pressure in both Tesla’s core automotive and energy storage businesses, how operating cash flow can cover increasingly high Capex investments will be a major issue.
From Tesla’s stock price perspective, the automotive business accounts for less than one-third of its market value, with market focus gradually shifting from automotive to AI. Automotive and energy storage primarily serve as “cash cows.”
Since about two-thirds of Tesla’s market value still highly depends on AI business development, each quarterly financial report serves as a critical test of whether its ambitious AI plans are materializing as expected and a key moment for future AI growth plans:
① Optimus: No key milestone confirmations
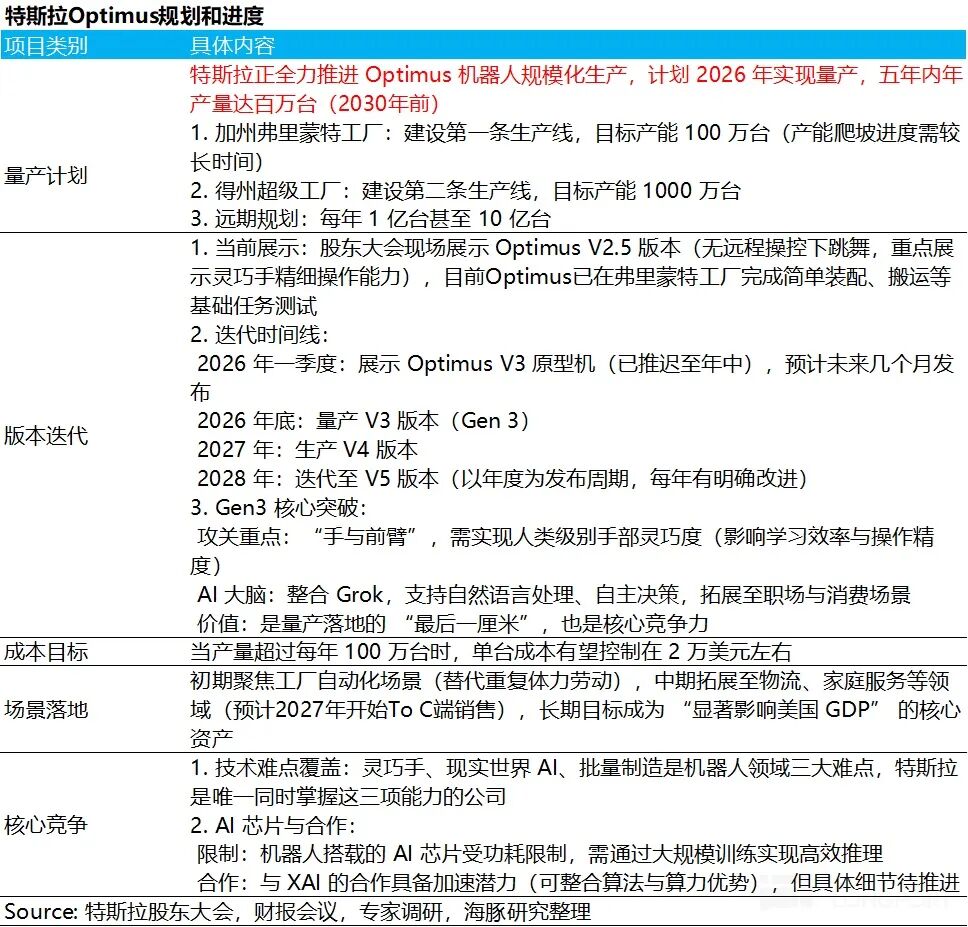
As Optimus progresses from concept to production readiness, substantive advancements (e.g., design completion, production launch, external orders) are crucial for supporting its long-term scalability vision (1 million units by 2030) and valuation.
During last quarter’s earnings call, Tesla provided clear guidance:
- Optimus V3 demonstration: Design nearly finalized, planned for mid-2026.
- Mass production timeline: Fremont factory preparing for production start in late July or August. A second Optimus factory is under construction at Giga Texas, expected to launch in summer 2027.
- Production ramp: Musk stated this is a brand-new product with over 10,000 unique components and a new supply chain. Initial production will be very slow, with capacity expected to reach meaningful levels only by 2027.
However, according to MS citing industry reports, Tesla has started providing suppliers with capacity guidance of 1,000 units per week (before September) and 2,000–2,500 units per week (by year-end), raising market expectations for Optimus production ramp.
- Application scenarios: Optimus has begun performing simple tasks in Tesla factories, with management expecting deployment in non-Tesla companies “sometime next year.”
During this earnings call, none of these key milestones were reconfirmed. Instead, Tesla painted an even grander vision: Optimus 4 aims for annual production capacity of 10 million units, an order of magnitude increase from Optimus (1 million units).
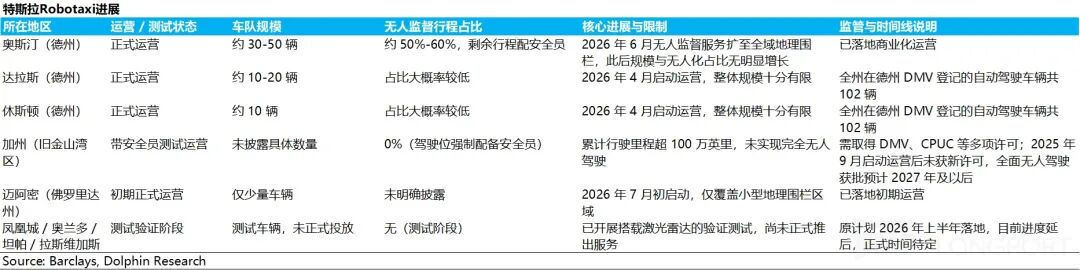
② Robotaxi: The long-awaited “inflection point” for large-scale commercialization remains unverified
Tesla’s autonomous driving strategy hinges on achieving faster scalability than peers through low-cost (~$30,000) vehicles without pre-collecting high-definition maps.
Thus, Robotaxi is considered one of the core drivers of Tesla’s stock price (faster monetization and higher feasibility than Optimus), with investors primarily focused on expansion cities/regions, the share of “unsupervised” driving in total trips, and Cybercab production progress.
However, from investors’ perspective, Robotaxi deployment remains “slow”:
Tesla operates a small fleet of ~30–50 vehicles in Austin, with only ~50–60% of trips unsupervised.
In contrast, Waymo already has ~3,800 vehicles operating in over 30 cities, leaving Tesla in the early commercialization stage.
Thus, while Robotaxi progress remains slow, market expectations are extremely high, viewing it as key to Tesla’s valuation. Investors are eagerly awaiting an “inflection point” proving large-scale commercialization is possible.
During last quarter’s earnings call, Tesla outlined its Robotaxi operational outlook: hoping to achieve unsupervised operations in over a dozen states by year-end. However, due to stringent safety validation requirements and the current test fleet still running on V14.3 (with a major V15 safety overhaul pending), management deemed large-scale Robotaxi deployment unreasonable.
Thus, Robotaxi and unsupervised FSD will not significantly contribute to financials in 2026, with the financial inflection point pegged to 2027.
During this earnings call, Tesla only mentioned that new city rollouts are becoming easier and faster, with a future goal of expanding from “city-by-city” to “state-wide” coverage, aiming for 99%+ reliability and requiring dedicated Cybercab-related data accumulation before large-scale deployment. This implicitly suggests Robotaxi’s large-scale expansion may be further delayed.
For Cybercab (the $30,000 dedicated two-seater without a steering wheel), trial production began in April 2026, but volumes remain limited, with no specific guidance on large-scale production timing.
③ FSD: No confirmation of “full unsupervised driving” timeline
Market expectations for FSD center on when it can roll out “unsupervised” FSD (allowing drivers to sleep or disengage) to consumer vehicles.
FSD progress not only impacts Robotaxi expansion but also directly enhances Tesla’s vehicle appeal (e.g., Q2 U.S. deliveries exceeded expectations, partly due to consumers purchasing for FSD) and converts into high-margin subscription revenue (FSD gross margin ~90%), boosting overall profitability.
Musk previously stated on the 1Q26 earnings call that Tesla would be very cautious about rolling out “unsupervised” FSD to consumers due to safety concerns, estimating the earliest possible timeline as Q4 2026 (4Q26).
However, this earnings call also did not reconfirm a “full unsupervised driving” timeline.
Progress on the regulatory front was FSD’s biggest achievement in Q2 2026:
- Europe: FSD (Supervised) gained approval in the Netherlands, Belgium, Denmark, Estonia, Lithuania, and other European countries. Dutch regulators plan to seek EU-wide approval from the European Commission, paving the way for broader EU approvals.
- China: FSD is undergoing approval processes in China, with management stating on the April earnings call they were “hoping” for approval in Q3 2026.
Thus, FSD’s technical and regulatory progress is accelerating, but the market’s most anticipated milestone—when “unsupervised” FSD will be available to individual consumers—remains the key driver for vehicle sales and Robotaxi business, as well as a core variable for market sentiment. This was also not reconfirmed this quarter.
Therefore, with Tesla’s financial results falling short of expectations this quarter and profit margins continuing to decline in both automotive and energy storage businesses—failing to provide Tesla with safe “operating cash flow”—Tesla’s capital expenditures remain at a high level ($25+ billion in 2026) and are expected to grow further over the next 2–3 years. Tesla’s AI ambitions must urgently achieve commercial viability and self-sustaining revenue, or the company may face realistic financing pressures within the next 1–2 years.
Moreover, AI business progress (Optimus, FSD, or Robotaxi) did not receive key milestone confirmations in this earnings call, heightening market concerns about AI monetization uncertainty.
Thus, Dolphin Research expects Tesla’s stock price to remain under pressure post-earnings—especially with AI business dominating valuation—unless there are Exceed expectations (better-than-expected) AI advancements or new narratives (e.g., a Tesla + SpaceX merger, telling a story spanning AI infrastructure, AI models, and AI software/hardware applications) to support its high valuation.
Here’s a detailed analysis:
1. Tesla: Revenue meets expectations, but gross margin faces significant pressure
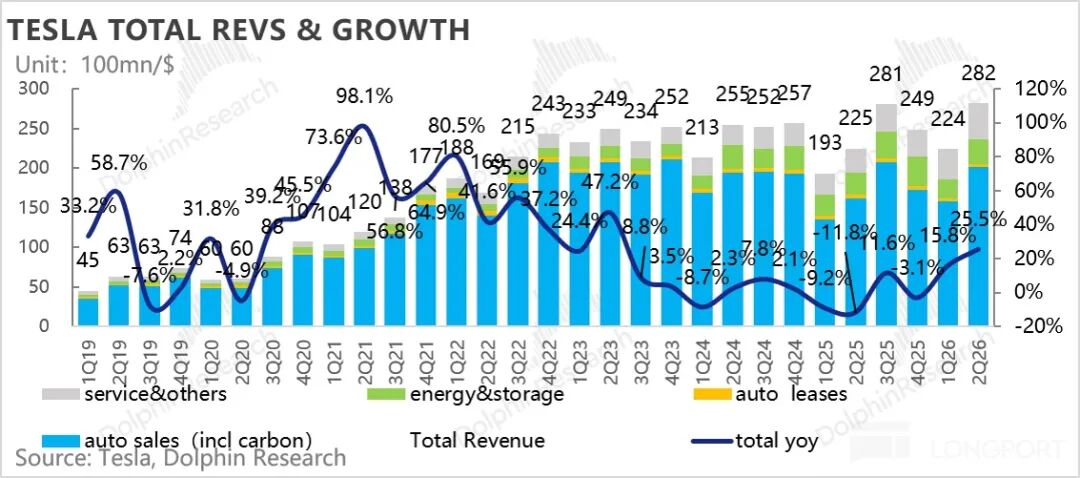
Tesla’s Q2 total revenue reached $28.2 billion, up 25.5% year-over-year, roughly in line with the expected $28.1 billion. However, this included a positive foreign exchange impact of $500 million. Excluding this one-time factor, adjusted revenue was $27.7 billion, slightly below expectations.
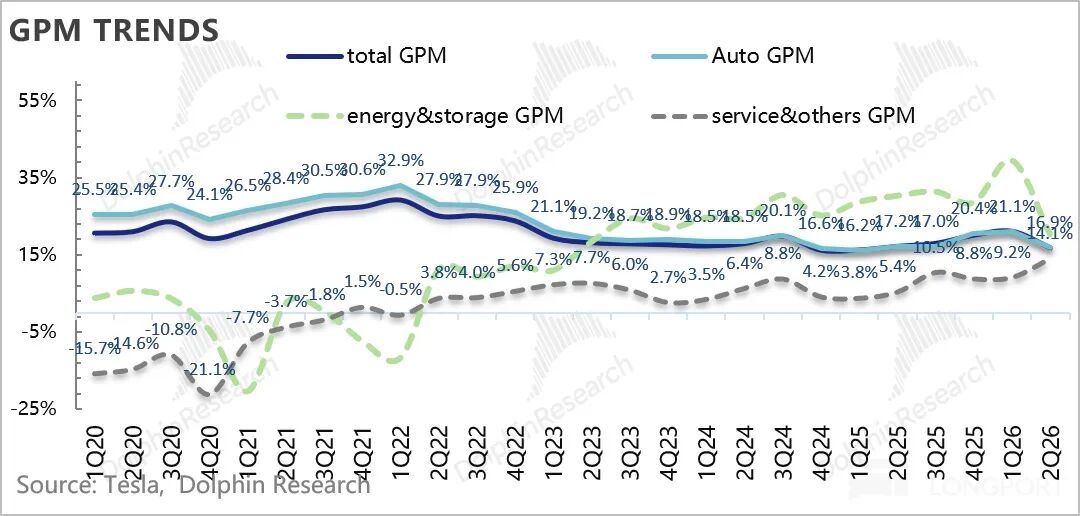
In terms of gross margin, Q2 overall gross margin was 16.8%, down 4.3 percentage points quarter-over-quarter and also below the expected 19.5%, indicating significant margin pressure. Breaking it down by business line:
① Automotive Business: Revenue Meets Expectations, but Profit Margins Remain Under Pressure:
This quarter, the automotive segment's total revenue reached RMB 20.5 billion, up 23% year-over-year, essentially in line with the expected RMB 20.6 billion. Within this:
- Gross profit from carbon credits amounted to RMB 150 million, down RMB 230 million sequentially. This decline was within market expectations, primarily due to adjustments in earlier carbon emission regulations.
- Core automotive sales revenue (excluding carbon credits and leasing income) stood at RMB 20 billion, roughly in line with market expectations. The 27% year-over-year increase was mainly driven by higher vehicle sales volumes, although the average selling price (ASP) per vehicle continued to decline sequentially. This quarter, the ASP was $42,000, down $1,300 sequentially.
- In terms of gross profit margin on vehicle sales, this quarter it was 16.9%, lower than the market expectation of 19.5%, mainly due to reduced recognition of high-margin carbon credit revenue.
- However, when considering the true gross profit margin on vehicle sales (excluding carbon credits and leasing income), it was only 16.3% this quarter. Despite vehicle sales volumes significantly exceeding expectations, the gross profit margin on vehicle sales declined by 2.9 percentage points sequentially and also fell short of the expected 18.4%.
- Last quarter, Tesla benefited from a one-time warranty and tariff credit of $250 million, which contributed approximately 2 percentage points to the gross profit margin. This benefit did not recur this quarter. Additionally, rising commodity prices and increased interest costs due to higher interest rates put pressure on the gross profit margin on vehicle sales this quarter.
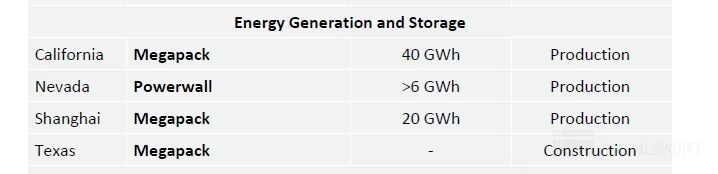
② Energy Business: Poor Performance, Significant Decline in Gross Profit Margin, and Substantially Increased Market Competition
This quarter, the energy segment's revenue was $3.14 billion. Although energy storage shipments reached 13.5 GWh, the ASP per watt-hour for the energy storage business continued to decline sequentially from $0.27/Wh last quarter to $0.23/Wh (rough estimate). The main reasons for this decline are:
a. A one-time adjustment of $240 million in Q1 related to cell issues in existing deployed projects and the absence of over $200 million in tariff benefits from Q1 in this quarter.
b. Continued decline in ASP for commercial and industrial energy storage due to increased competition.
With the significant decline in energy storage ASP and reduced recognition of one-time benefits, the gross profit margin for the energy storage business plummeted from 39.5% to 20.4%.
Management expects the long-term gross profit margin for the energy storage business to stabilize in the low-to-mid 20% range, significantly lower than Tesla's previous steady-state level of over 30% for energy storage. This reflects a substantial increase in competition in the energy storage market, even in the United States.
③ Service Business Performs Well
In Q2, the service segment generated $4.58 billion, exceeding expectations of $3.72 billion. The gross profit margin improved sequentially from 9.2% to 14.1%, reaching a record high, primarily driven by increased sales volumes and improved fleet cost management (including used cars, Superchargers, service centers, and insurance business).
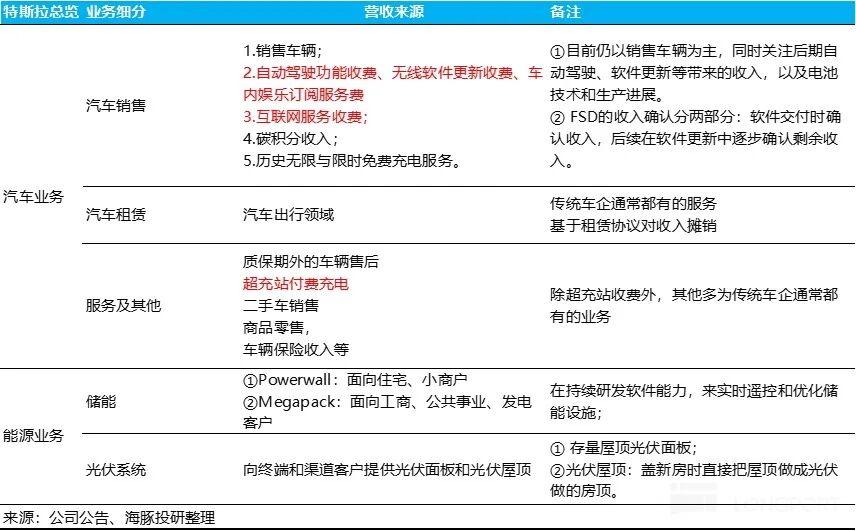
II. Gross Profit Margin on Vehicle Sales Falls Short of Expectations
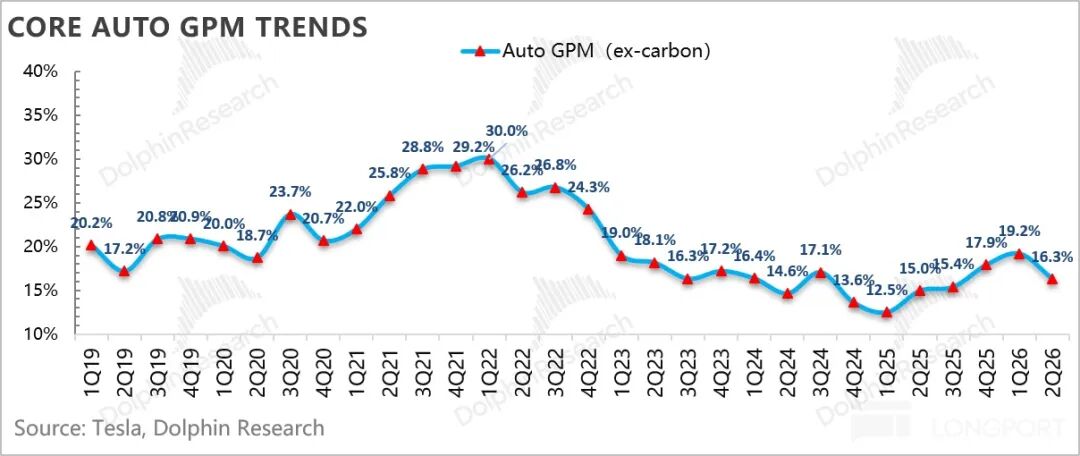
As the most critical metric to observe each quarter, the automotive gross profit margin is of utmost importance, especially given the aging of Tesla's current vehicle lineup and intensifying competition. To gain a clearer understanding of the true situation of the automotive gross profit margin, Dolphin Research has broken it down into gross profit margins for vehicle sales excluding carbon credits, vehicle leasing, and the overall automotive business.
Due to a significant sequential rebound in Tesla's vehicle sales volumes in Q2 (up 34% sequentially to 480,000 units), the market held relatively high expectations for Tesla's gross profit margin on vehicle sales in Q2. However, the gross profit margin on automotive sales (excluding carbon credits and leasing) was only 16.3%, lower than the market expectation of 18.4%, and declined by 3 percentage points sequentially from last quarter.
Last quarter, Tesla benefited from a one-time warranty and tariff credit of $250 million, which contributed approximately 2 percentage points to the gross profit margin. This benefit did not recur this quarter.
As a result, the sequential decline in the true gross profit margin on vehicle sales this quarter was mainly due to the absence of the aforementioned one-time benefits, coupled with a decline in vehicle sales revenue and an increase in raw material costs for vehicle production. Specifically:
Looking at the per-vehicle economics in detail:
2.1 Average Selling Price per Vehicle Declines Sequentially
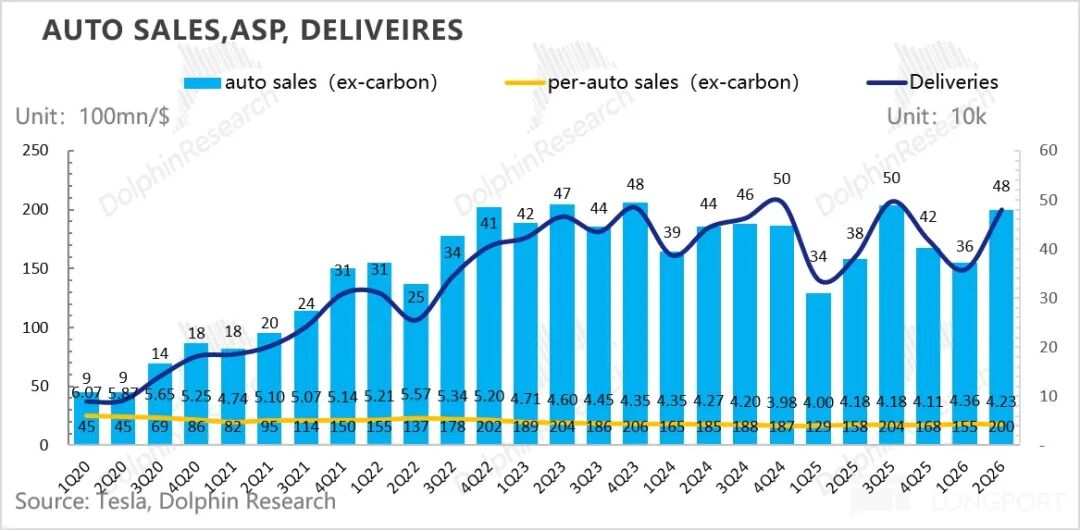
From the perspective of ASP per vehicle, in Q2, Tesla's revenue per vehicle sold (excluding carbon credits and automotive leasing sales) was $42,000, down $1,300 sequentially but essentially in line with expectations.
The sequential decline may be attributed to a shift in the product mix toward lower-priced models (discontinuation of Model S/X), ongoing promotional offers offsetting the impact of minor price increases on certain models (especially the rise in interest costs due to higher interest rates), and negative regional mix effects (decline in the U.S. share, increase in Europe and other countries).
Specifically:
① Minor Price Increases in Q2, but Promotional Offers Continue to Offset the Impact
a. United States: Minor Price Increases
In the U.S. market, Tesla slightly raised the price of the Model Y by $1,000 but offered 0% APR financing for 72 months on the Model Y (RWD) and continued to offer 0.99% APR financing for other models, along with promotional discounts such as a 30-day free trial of FSD.
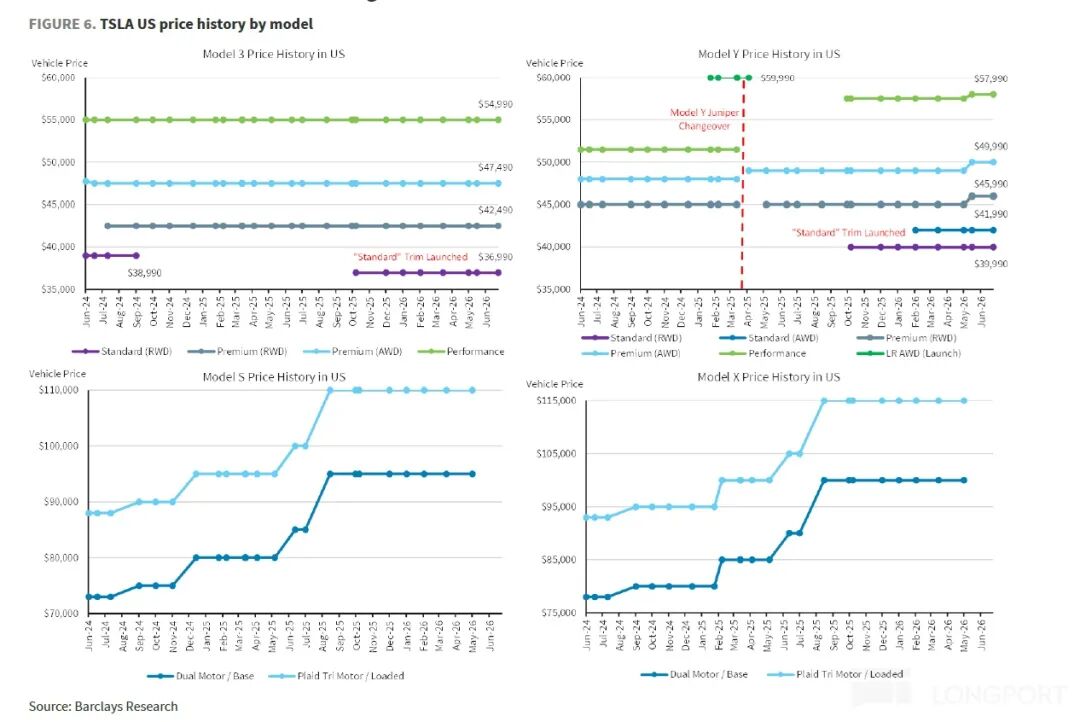
b. China: Continued Subsidies
Although Tesla has not adjusted prices in China, it has introduced the "Easy Loan" service to lower the threshold for consumers to purchase vehicles, continued to offer 5-year zero-interest financing, and provided other subsidies such as paint discounts and inventory vehicle discounts.
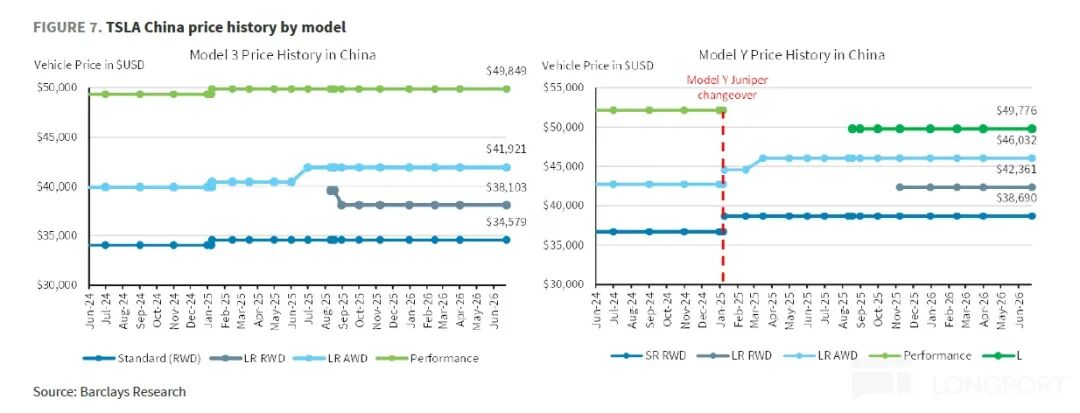
c. Europe: Minor Price Increases
In Q2, similar to the U.S., the price of the Model Y was slightly increased by $1,000, and Tesla also launched zero-interest financing campaigns in major European markets.
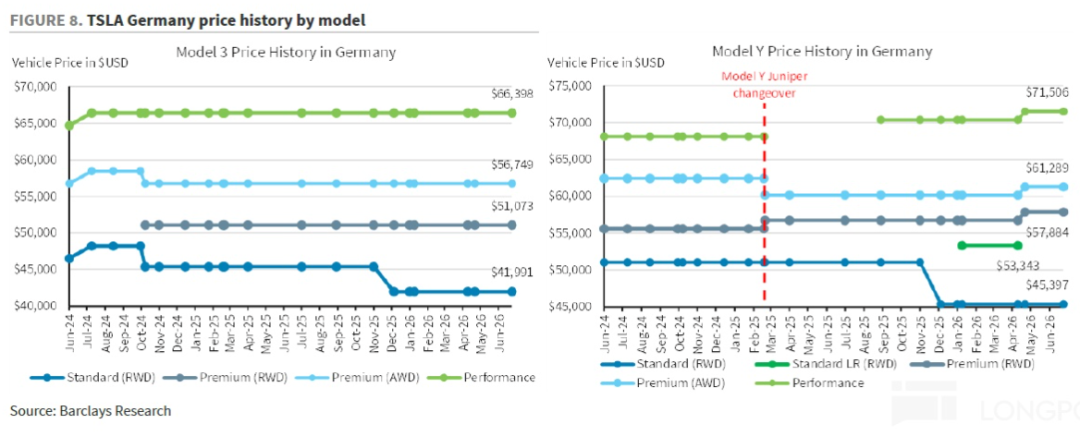
② Vehicle Mix: Decline in the Share of Higher-Priced Model S/X + Cybertruck
From the perspective of vehicle mix, the share of Tesla's higher-priced Model S/X + Cybertruck in this quarter declined by 2 percentage points sequentially from 4.5% last quarter to 2.6%, mainly due to the discontinuation of the Model S/X, which also lowered the overall ASP per vehicle.
③ FSD Business: Continues to Maintain High Growth
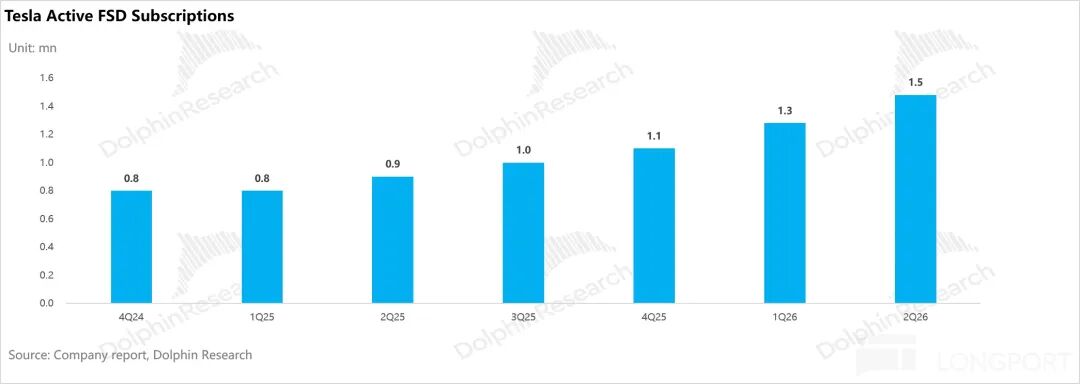
In Q2, the global number of paying FSD users reached nearly 1.48 million (a net increase of 200,000 sequentially), representing a year-over-year growth of 42% and setting a new record for net new users in a single quarter (200,000). This is expected to be due to:
a. The widespread rollout of FSD V14.3 in Q2.
b. Tesla offering a 30-day free trial of FSD, promoting user conversion.
c. FSD's approval in multiple European countries in Q2, driving growth in the number of new paying users in Europe.
d. Starting from February 15, 2026, Tesla globally discontinued the one-time purchase option for FSD and fully transitioned to a monthly subscription model (currently priced at $99/month), lowering the barrier to entry for users.
The proportion of new FSD users to new vehicle sales also reached 42% this quarter, with FSD paying users accounting for approximately 15% of Tesla's global existing fleet. As high-margin software revenue, it directly thickening s (increases) the gross profit margin of the core automotive business.
2.3 Per-Vehicle Costs Continue to Rise
After discussing per-vehicle pricing, let's now examine per-vehicle costs. Typically, Tesla's cost reduction comes from four dimensions: 1) economies of scale from increased sales volumes and full utilization of production capacity; 2) technological cost reductions; 3) natural cost reductions in battery raw materials; 4) government subsidies. Specifically:
Dolphin Research breaks down per-vehicle costs into depreciation per vehicle and variable costs per vehicle. The per-vehicle economics in Q2 were as follows:
1) Depreciation per Vehicle: Economies of Scale Partially Hindered, Depreciation per Vehicle Continues to Rise Sequentially
In this quarter, depreciation per vehicle was $0.34, down $1,080 sequentially in absolute terms. The depreciation cost rate per vehicle also declined by 2 percentage points sequentially from 10.2% last quarter to 8% this quarter, mainly due to the significant sequential rebound in vehicle sales volumes by 34% this quarter, which released economies of scale.
2) Variable Costs per Vehicle: Variable Costs Continue to Rise
In this quarter, the company's variable costs per vehicle were $32,000, up $1,180 sequentially. The increase in variable costs was mainly due to sustained rises in the prices of key automotive metals such as lithium, steel, aluminum, and copper, as well as increased costs for DRAM (memory) and precious metals (gold, silver), collectively exerting significant cost pressure.
3) Gross Profit Margin on Vehicle Sales Falls Short of Expectations
Ultimately, although economies of scale were significantly realized, limited by the sequential decline in ASP per vehicle and the increase in per-vehicle costs due to rising raw material prices, the gross profit margin on vehicle sales, after removing one-time factors and carbon credits, was 16.3% in Q2, lower than the market expectation of 18.4%.
III. Explosive Growth in Europe and Other Countries in Q2 Drives Vehicle Sales Volumes Beyond Expectations
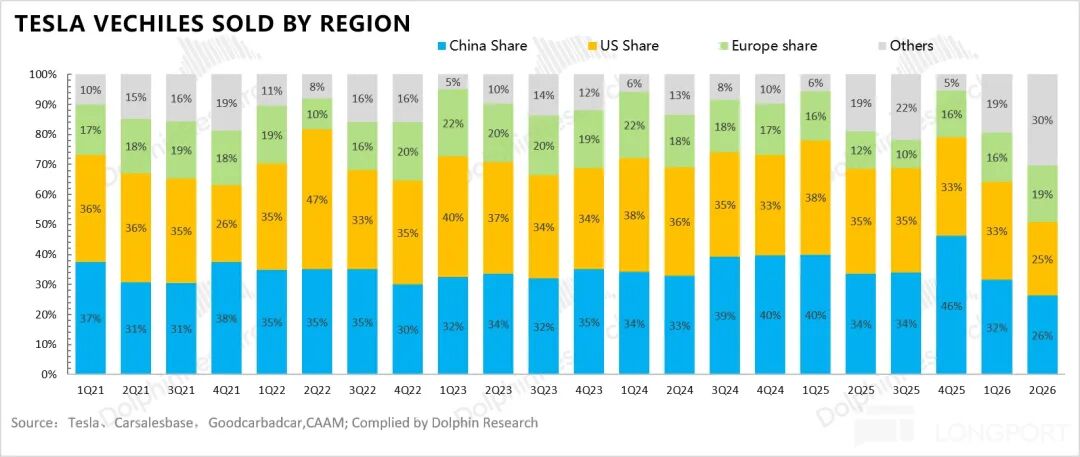
In Q2, Tesla actually delivered 480,000 vehicles, significantly higher than the market expectation of around 400,000 units, mainly due to explosive growth in Europe and other markets.
① European Market Becomes the Largest Growth Engine: The European market was the biggest highlight in Q2, with sales volumes in multiple countries increasing by over 100% year-over-year. The main driving factors include:
a. Policy subsidies and high fuel prices: Multiple European countries maintained or reinstated electric vehicle subsidy policies (e.g., France expanded its social leasing program, and the UK reinstated subsidies), coupled with high fuel prices driving consumers to switch to new energy vehicles, directly stimulating consumer demand.
b. FSD (Supervised) also received approval in multiple European countries in Q2, including the Netherlands, Belgium, Denmark, Estonia, and Lithuania, enhancing product attractiveness and indirectly boosting sales volumes.
② Tesla's Sales in the Chinese Market Remain Robust: Ringing up an 11.5% growth rate sequentially, benefiting from effective promotional activities such as the launch of the long-range version of the Model Y, 5-year zero-interest financing, and market expectations for FSD approval. Tesla's performance in the Chinese market outperformed the overall industry.
③ U.S. Market Sales Remain Essentially Flat Sequentially in Q2: However, sales volumes were still down 13% year-over-year, mainly affected by a high base due to demand being pulled forward before the expiration of EV subsidies in the same period in 2025. The attractiveness of FSD (some consumers purchased vehicles to use FSD) and promotional activities (0.99% APR, FSD free trial) supported sales volumes, but overall recovery is still pending.
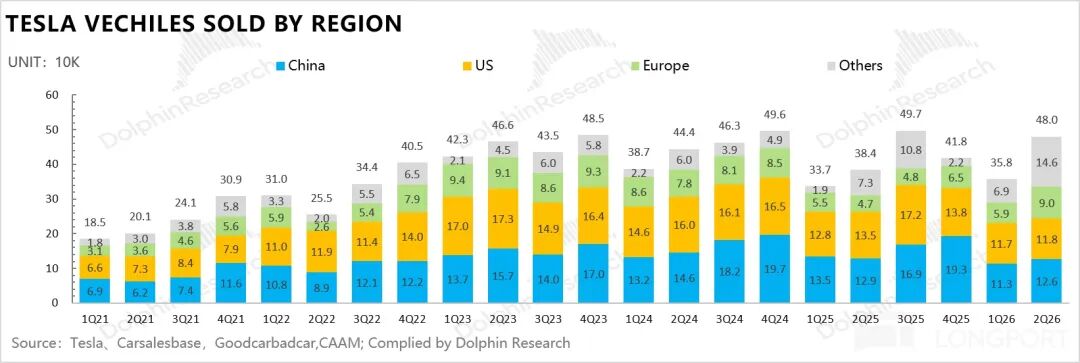
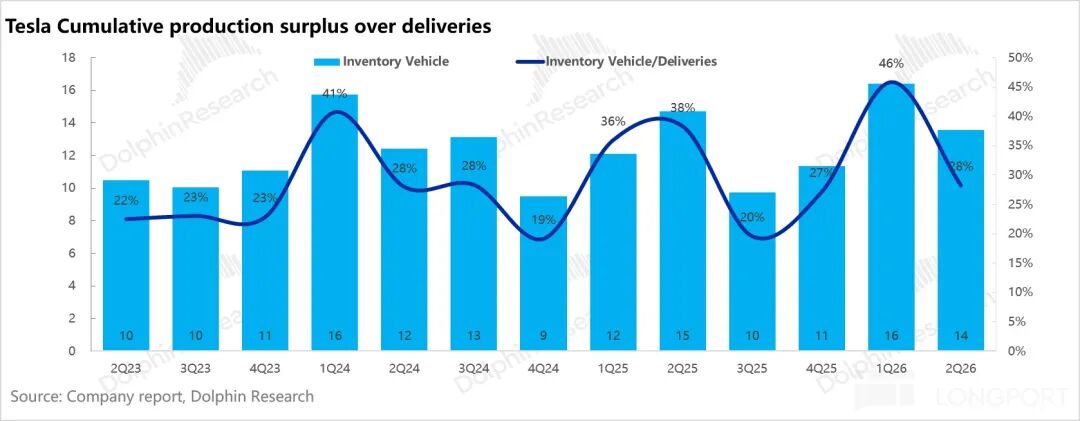
From the perspective of production and sales gap, Tesla produced 450,000 vehicles in Q2, while deliveries reached 480,000 units, with production falling short of deliveries by 28,000 units. Inventory was digested, and Tesla's inventory turnover days decreased from 16 days last quarter to 14 days this quarter.
The reduction in inventory also directly improved operating costs, driving operating cash flow up $760 million sequentially to $4.7 billion.
IV. Expenditure Side: Continued Heavy Investment in AI Business
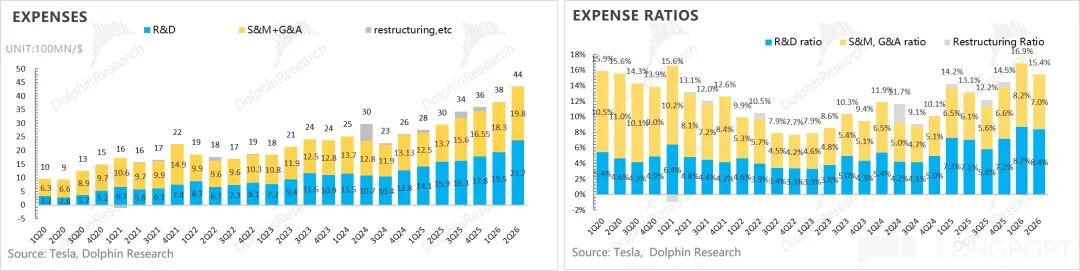
Tesla's R&D expenses and selling, general, and administrative (SG&A) expenses continued to increase this quarter. R&D expenses reached $2.37 billion, up $420 million sequentially, still due to continued heavy investment in AI intelligence and new product R&D. R&D expenses were mainly invested in FSD training and iteration, AI5 chip design, and the R&D of new product lines such as Cybercab and Optimus.
The selling, general and administrative expenses (SG&A) reached 1.98 billion this quarter, up by 150 million USD quarter-over-quarter, also exceeding market expectations of 1.8 billion. This increase was primarily due to a rise in SBC expenses by approximately 190 million USD (mainly attributable to increased CEO performance bonuses), driving up SG&A costs.
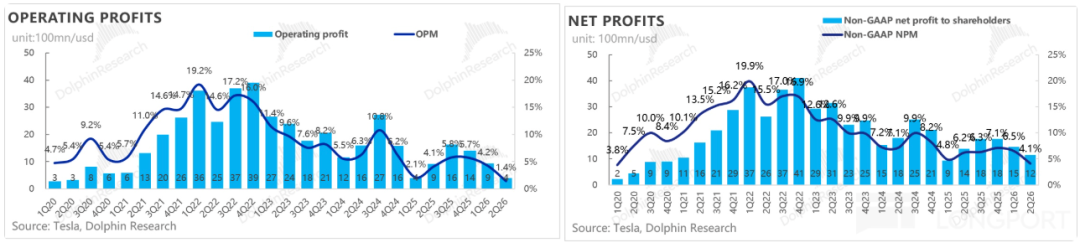
Ultimately, due to the lower-than-expected gross margin, combined with increases in R&D and SG&A expenses, operating profit stood at only 400 million USD, significantly below market expectations of 1.7 billion USD. The operating profit margin also declined by 2.8 percentage points quarter-over-quarter to 1.4%.
Regarding net profit, this quarter saw a net profit of 1.1 billion USD due to equity investment gains from SpaceX's public listing (1 billion USD in gains recognized), with the net profit margin increasing by 1.8 percentage points quarter-over-quarter to 3.9%.
In terms of free cash flow, the release of inventory increased operating cash flow by 760 million USD quarter-over-quarter to 4.7 billion USD. However, a sharp rise in capital expenditures this quarter (up by 3.3 billion USD quarter-over-quarter to 5.8 billion USD) resulted in free cash flow of only -1.1 billion USD, a decline of 2.5 billion USD quarter-over-quarter.
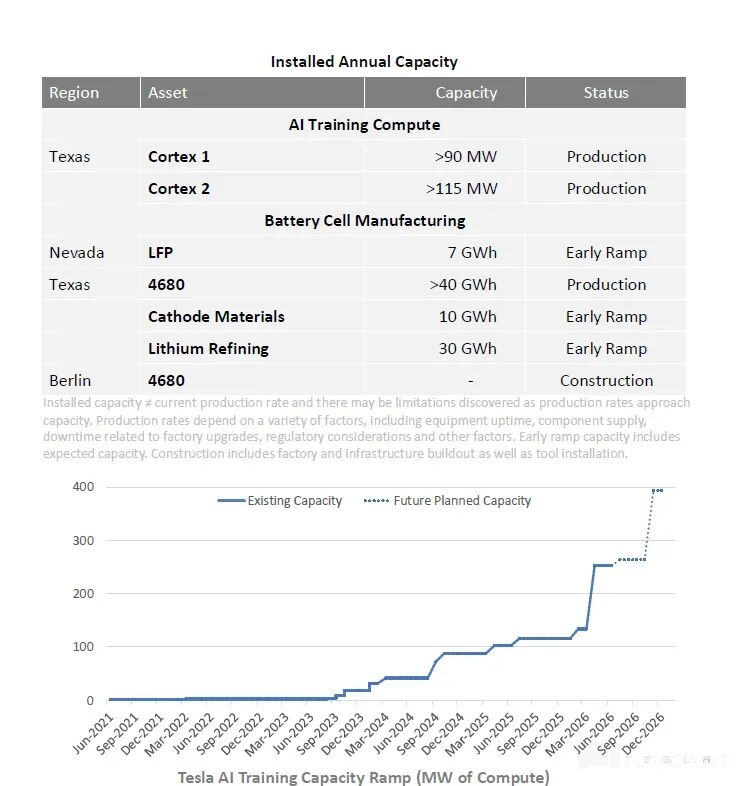
This quarter's capital expenditures were primarily invested in AI computing power infrastructure. The Cortex 2 training cluster is now online and operational, handling workloads. To support the training of Optimus and autonomous driving models, investments in computing power continue to rise significantly.
In the second quarter, the Cortex training cluster achieved a computing power level equivalent to over 250,000 H100 units, doubling from nearly 150,000 units in the first quarter. By the end of the year, Tesla plans to double the computing power of the Cortex 2 training cluster again to reach 400,000 equivalent H100 units, with capital expenditures continuing to expand.
The company significantly raised its 2026 capital expenditure guidance last quarter from 'over 20 billion USD' to 'over 25 billion USD.' This quarter, the guidance remains unchanged at over 25 billion USD in Capex, primarily aimed at expanding the Robotaxi fleet, increasing Optimus production capacity, constructing semiconductor factories, boosting solar manufacturing capacity, and building AI computing power infrastructure.
Despite ample cash and investments on hand (43.5 billion USD), at the current capital expenditure intensity of over 25 billion USD per year, existing cash can only sustain high-intensity investments for less than two years. The ambitious long-term AI blueprint urgently needs to translate into substantial revenue and cash flow; otherwise, the company will face potential financing pressures.
- END -
// Reprint Authorization
This article is an original work by Dolphin Research. Reprinting requires authorization.
// Disclaimer and General Disclosure Notice
This report is intended for general comprehensive data purposes, designed for general reading and data reference by users of Dolphin Research and its affiliated institutions. It does not consider the specific investment objectives, investment product preferences, risk tolerance, financial status, or special needs of any individual receiving this report. Investors must consult with independent professional advisors before making investment decisions based on this report. Any person making investment decisions using or referring to the content or information in this report assumes all risks. Dolphin Research shall not be liable for any direct or indirect responsibilities or losses that may arise from using the data contained in this report. The information and data in this report are based on publicly available sources and are for reference purposes only. Dolphin Research strives to ensure but does not guarantee the reliability, accuracy, or completeness of the information and data.
The information or opinions mentioned in this report shall not, under any jurisdiction, be considered or construed as an offer to sell securities or an invitation to buy or sell securities, nor shall they constitute advice, solicitations, or recommendations regarding relevant securities or related financial instruments. The information, tools, and materials in this report are not intended for distribution to or use by individuals or residents of jurisdictions where such distribution, publication, provision, or use would contravene applicable laws or regulations or result in Dolphin Research and/or its subsidiaries or affiliated companies being subject to any registration or licensing requirements in such jurisdictions.
This report reflects only the personal views, insights, and analytical methods of the relevant contributors and does not represent the stance of Dolphin Research and/or its affiliated institutions.
This report is produced by Dolphin Research, and its copyright is solely owned by Dolphin Research. Without prior written consent from Dolphin Research, no institution or individual may (i) produce, copy, duplicate, reproduce, forward, or create any form of copies or reproductions in any manner, and/or (ii) directly or indirectly redistribute or transfer them to other unauthorized persons. Dolphin Research reserves all related rights.
-
![]()
Used Cars Step into the Limelight Alongside New Cars: What Does This Trend Indicate?
-
![]()
After 20 Million Vehicles, How Can Chery Conquer the 'Brand Value' Challenge?
-
![]()
Xiaomi Pengcheng Set to Unveil Two New Models at Launch Event!
-
![]()
Can Beijing Hyundai Make a Comeback?
-
![]()
Still Thrivings: Top Fuel-Powered Cars with Over 10,000 Sales in June
-
![]()
Surprise! 17 Fuel-Powered Vehicles Surpass 10,000 Units in Sales for June
-
![]()
Mercedes-Benz Halts Production of Electric CLA L in China Less Than a Year After Launch
-
![]()
China's Top 10 Provincial Economies: A Major Reshuffle Underway